See more : Savera Industries Limited (SAVERA.BO) Income Statement Analysis – Financial Results
Complete financial analysis of Public Joint Stock Company Mining and Metallurgical Company Norilsk Nickel (NILSY) income statement, including revenue, profit margins, EPS and key performance metrics. Get detailed insights into the financial performance of Public Joint Stock Company Mining and Metallurgical Company Norilsk Nickel, a leading company in the Industrial Materials industry within the Basic Materials sector.
- Cairo Communication S.p.A. (0N7I.L) Income Statement Analysis – Financial Results
- Anjani Synthetics Limited (ANJANI.BO) Income Statement Analysis – Financial Results
- DHC Acquisition Corp. (DHCA) Income Statement Analysis – Financial Results
- Lion Travel Service Co., Ltd. (2731.TW) Income Statement Analysis – Financial Results
- Brookdale Senior Living Inc. (BKDTU) Income Statement Analysis – Financial Results
Public Joint Stock Company Mining and Metallurgical Company Norilsk Nickel (NILSY)
About Public Joint Stock Company Mining and Metallurgical Company Norilsk Nickel
Public Joint Stock Company Mining and Metallurgical Company Norilsk Nickel, together with its subsidiaries, operates as a metals and mining company in Europe, Asia, North and South America, Russia, and the CIS countries. The company operates through GMK Group, South Cluster, KGMK Group, NN Harjavalta, GRK Bystrinskoye, Other Mining, and Other Non-Metallurgical segments. It explores for, extracts, and refines ore and nonmetallic minerals; and sale of base and precious metals produced from ore. The company's products include nickel, palladium, copper, platinum, cobalt, rhodium, iridium, ruthenium, silver, gold, selenium, tellurium, sulphur, sodium sulfate, and sodium chloride. It is also involved in property and equipment rental, gas extraction and transportation, electricity production and distribution, ore mining and processing, construction, mining and metallurgy repairs, spare parts production, geological works and construction, distribution, research, fuel supply, river shipping, and airport businesses, as well as acts as an air company. Public Joint Stock Company Mining and Metallurgical Company Norilsk Nickel was incorporated in 1997 and is based in Moscow, Russia.
| Metric | 2023 | 2022 | 2021 | 2020 | 2019 | 2018 | 2017 | 2016 | 2015 | 2014 | 2013 | 2012 | 2011 | 2010 | 2009 | 2008 | 2007 | 2006 | 2005 | 2004 | 2003 | 2002 | 2001 |
|---|---|---|---|---|---|---|---|---|---|---|---|---|---|---|---|---|---|---|---|---|---|---|---|
| Revenue | 14.41B | 16.88B | 17.85B | 15.55B | 13.56B | 11.67B | 9.15B | 8.26B | 8.54B | 11.87B | 11.50B | 12.37B | 14.12B | 12.78B | 10.16B | 13.98B | 17.12B | 11.55B | 7.17B | 7.03B | 5.20B | 3.09B | 4.38B |
| Cost of Revenue | 7.04B | 5.72B | 4.71B | 4.75B | 4.96B | 4.92B | 4.57B | 4.16B | 3.77B | 5.67B | 6.50B | 6.15B | 5.79B | 4.88B | 5.65B | 7.63B | 5.88B | 3.16B | 2.99B | 3.18B | 2.87B | 1.75B | 2.40B |
| Gross Profit | 7.37B | 11.16B | 13.14B | 10.80B | 8.61B | 6.76B | 4.58B | 4.10B | 4.77B | 6.20B | 5.00B | 6.22B | 8.33B | 7.89B | 4.50B | 6.35B | 11.24B | 8.39B | 4.18B | 3.85B | 2.33B | 1.34B | 1.98B |
| Gross Profit Ratio | 51.12% | 66.12% | 73.63% | 69.44% | 63.46% | 57.88% | 50.02% | 49.64% | 55.85% | 52.19% | 43.51% | 50.31% | 58.98% | 61.78% | 44.34% | 45.45% | 65.64% | 72.66% | 58.24% | 54.80% | 44.77% | 43.41% | 45.23% |
| Research & Development | 0.00 | 0.00 | 0.00 | 0.00 | 0.00 | 0.00 | 0.00 | 0.00 | 0.00 | 0.00 | 0.00 | 0.00 | 0.00 | 0.00 | 0.00 | 0.00 | 0.00 | 0.00 | 0.00 | 0.00 | 0.00 | 0.00 | 0.00 |
| General & Administrative | 224.00M | 1.26B | 902.00M | 792.00M | 861.00M | 764.00M | 684.00M | 504.00M | 481.00M | 704.00M | 854.00M | 935.00M | 1.68B | 1.40B | 295.00M | 1.60B | 1.62B | 1.09B | 841.00M | 866.00M | 750.00M | 561.00M | 668.00M |
| Selling & Marketing | 215.00M | 250.00M | 191.00M | 167.00M | 133.00M | 92.00M | 75.00M | 50.00M | 51.00M | 110.00M | 71.00M | 63.00M | 0.00 | 0.00 | 0.00 | 0.00 | 0.00 | 0.00 | 0.00 | 0.00 | 0.00 | 0.00 | 0.00 |
| SG&A | 439.00M | 1.51B | 1.09B | 959.00M | 994.00M | 879.00M | 784.00M | 127.00M | 249.00M | 557.00M | 297.00M | 321.00M | 1.68B | 1.40B | 295.00M | 1.60B | 1.62B | 1.09B | 841.00M | 866.00M | 750.00M | 561.00M | 668.00M |
| Other Expenses | 1.39B | 0.00 | 0.00 | 0.00 | 1.07B | 814.00M | 990.00M | 631.00M | 732.00M | 762.00M | 1.37B | 1.46B | 243.00M | 0.00 | 511.00M | 230.00M | 1.10B | 278.00M | 58.00M | 153.00M | 60.00M | -27.00M | 259.00M |
| Operating Expenses | 1.61B | 3.57B | 3.74B | 5.73B | 1.03B | 1.05B | 1.42B | 758.00M | 981.00M | 1.32B | 1.67B | 1.78B | 1.92B | 1.40B | 806.00M | 1.83B | 2.73B | 1.37B | 899.00M | 1.02B | 810.00M | 534.00M | 927.00M |
| Cost & Expenses | 8.87B | 9.28B | 8.45B | 10.48B | 5.98B | 7.43B | 5.99B | 4.69B | 6.23B | 9.17B | 9.91B | 8.99B | 7.71B | 6.28B | 6.46B | 9.45B | 8.61B | 4.53B | 3.89B | 4.20B | 3.68B | 2.29B | 3.33B |
| Interest Income | 7.00M | 214.00M | 120.00M | 485.00M | 55.00M | 340.00M | 309.00M | 289.00M | 66.00M | 41.00M | 260.00M | 236.00M | 0.00 | 0.00 | 0.00 | 0.00 | 0.00 | 0.00 | 0.00 | 0.00 | 0.00 | 0.00 | 0.00 |
| Interest Expense | 519.00M | 36.77B | 299.00M | 437.00M | 436.00M | 484.00M | 519.00M | 449.00M | 325.00M | 178.00M | 375.00M | 289.00M | 151.00M | 138.00M | 147.00M | 397.00M | 307.00M | 21.00M | 95.00M | 72.00M | 0.00 | 0.00 | 0.00 |
| Depreciation & Amortization | 1.17B | 1.03B | 928.00M | 914.66M | 911.00M | 798.00M | 799.00M | 564.00M | 513.00M | 848.00M | 1.57B | 789.00M | 762.00M | 803.00M | 817.00M | 4.46B | 937.00M | 767.00M | 9.00M | -235.00M | -162.00M | 61.00M | 683.00M |
| EBITDA | 5.22B | 8.59B | 10.51B | 7.69B | 7.99B | 6.13B | 4.01B | 4.28B | 3.08B | 3.64B | 4.15B | 4.83B | 6.55B | 7.72B | 4.30B | 4.58B | 9.78B | 7.79B | 3.18B | 2.60B | 1.35B | 809.00M | 1.06B |
| EBITDA Ratio | 36.21% | 50.88% | 58.81% | 49.45% | 58.87% | 52.54% | 43.68% | 46.81% | 51.65% | 47.86% | 36.05% | 39.03% | 42.32% | 45.30% | 43.33% | 32.79% | 52.45% | 67.45% | 45.82% | 36.97% | 26.06% | 28.12% | 39.66% |
| Operating Income | 5.54B | 7.56B | 9.50B | 6.53B | 7.09B | 5.33B | 3.20B | 3.30B | 3.90B | 4.83B | 2.58B | 4.04B | 6.41B | 6.50B | 3.70B | 4.53B | 8.51B | 7.02B | 3.28B | 2.84B | 1.52B | 809.00M | 1.06B |
| Operating Income Ratio | 38.45% | 44.78% | 53.22% | 42.02% | 52.25% | 45.70% | 34.94% | 39.98% | 45.65% | 40.72% | 22.41% | 32.65% | 45.39% | 50.84% | 36.41% | 32.40% | 49.71% | 60.81% | 45.70% | 40.31% | 29.18% | 26.15% | 24.08% |
| Total Other Income/Expenses | -2.01B | -202.00M | -251.00M | -1.70B | 488.00M | -1.56B | -506.00M | -66.00M | -1.55B | -2.22B | -2.00B | -1.00B | -764.00M | 3.00M | -257.00M | -4.80B | -1.58B | -247.00M | -62.00M | -328.00M | -178.00M | 54.00M | 695.00M |
| Income Before Tax | 3.53B | 7.38B | 9.29B | 4.58B | 7.52B | 3.90B | 2.84B | 3.28B | 2.24B | 2.66B | 1.33B | 3.14B | 5.65B | 6.78B | 3.49B | -273.00M | 7.74B | 6.78B | 3.12B | 2.51B | 1.34B | 863.00M | 1.75B |
| Income Before Tax Ratio | 24.53% | 43.72% | 52.01% | 29.46% | 55.47% | 33.44% | 31.10% | 39.67% | 26.27% | 22.41% | 11.57% | 25.42% | 39.98% | 53.09% | 34.34% | -1.95% | 45.18% | 58.68% | 43.46% | 35.65% | 25.75% | 27.89% | 39.94% |
| Income Tax Expense | 664.00M | 1.53B | 2.31B | 945.00M | 1.56B | 843.00M | 721.00M | 745.00M | 528.00M | 660.00M | 565.00M | 1.00B | 1.46B | 1.55B | 836.00M | 282.00M | 2.46B | 1.81B | 838.00M | 696.00M | 493.00M | 286.00M | 503.00M |
| Net Income | 2.38B | 5.46B | 6.51B | 3.30B | 5.78B | 3.09B | 2.13B | 2.54B | 1.73B | 2.00B | 774.00M | 2.17B | 3.60B | 3.30B | 2.60B | -555.00M | 5.28B | 5.97B | 2.35B | 1.83B | 861.00M | 584.00M | 1.24B |
| Net Income Ratio | 16.55% | 32.34% | 36.48% | 21.21% | 42.63% | 26.44% | 23.28% | 30.71% | 20.30% | 16.88% | 6.73% | 17.55% | 25.52% | 25.82% | 25.60% | -3.97% | 30.82% | 51.65% | 32.81% | 26.05% | 16.57% | 18.88% | 28.18% |
| EPS | 0.16 | 0.10 | 0.42 | 0.21 | 36.69 | 0.20 | 13.98 | 16.67 | 11.39 | 13.15 | 5.07 | 14.18 | 21.53 | 19.46 | 15.42 | -0.03 | 30.23 | 32.82 | 12.11 | 9.23 | 4.35 | 1.55 | 2.46 |
| EPS Diluted | 0.16 | 0.10 | 0.42 | 0.21 | 36.69 | 0.20 | 13.98 | 16.67 | 11.39 | 13.15 | 5.07 | 14.18 | 21.53 | 19.46 | -12.11 | -0.03 | 30.23 | 32.82 | 12.11 | 9.23 | 4.35 | 1.55 | 2.02 |
| Weighted Avg Shares Out | 15.29B | 15.29B | 15.47B | 15.82B | 15.74B | 15.29B | 15.29B | 15.17B | 15.24B | 15.29B | 15.29B | 15.29B | 16.73B | 16.95B | 16.84B | 17.98B | 17.62B | 18.23B | 19.44B | 20.35B | 20.35B | 20.66B | 16.67B |
| Weighted Avg Shares Out (Dil) | 15.29B | 15.29B | 15.47B | 15.82B | 15.74B | 15.29B | 15.29B | 15.17B | 15.24B | 15.29B | 15.29B | 15.29B | 16.75B | 16.96B | 16.84B | 17.98B | 17.62B | 18.23B | 19.44B | 20.35B | 20.35B | 20.66B | 20.35B |
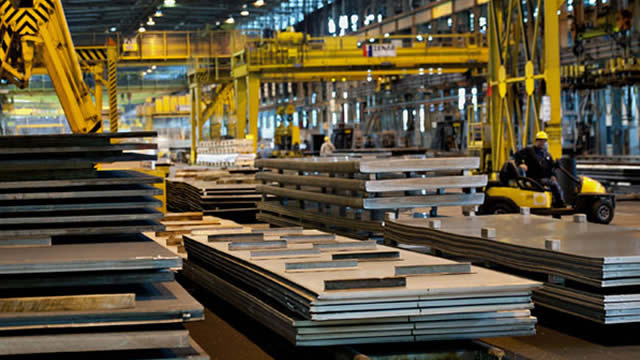
Russian mining giant Nornickel reports production decline for all metals in 9M 2021

Cobalt Miners News For The Month Of September 2021

Norilsk Nickel: High Dividends, Commodity Exposure, And Improved ESG At A Low Price
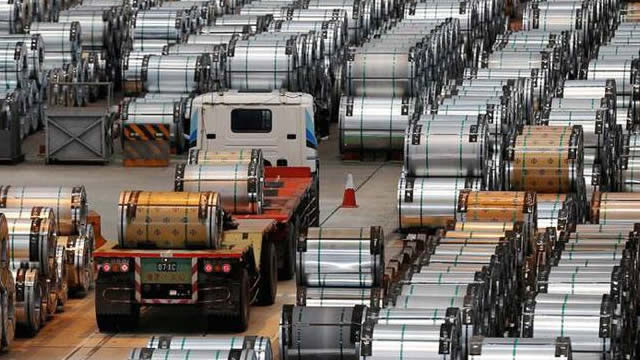
Russian mining giant Nornickel generates value from waste tailings
Nornickel, Russian fisheries agency in talks to settle $806 million claim
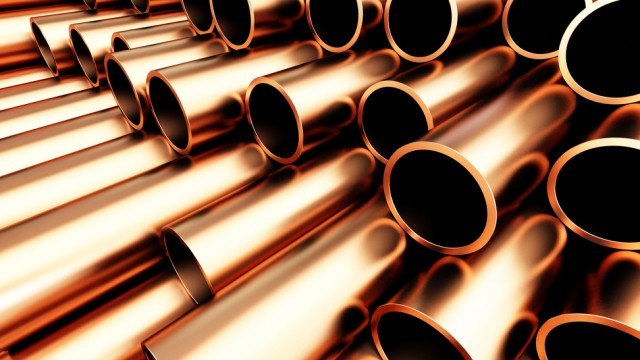
Norilsk Nickel launches physically-backed copper and nickel ETCs
Nickel Miners News For The Month Of August 2021

Public Joint Stock Company Mining and Metallurgical Company Norilsk Nickel's (NILSY) Management on Q2 2021 Results - Earnings Call Transcript
Nornickel reports net debt increase in H1 2021 as environmental damages weigh in
Nornickel extends nuclear-powered icebreaker support of its vessels in the Arctic
Source: https://incomestatements.info
Category: Stock Reports
