See more : Sharpe Resources Corporation (SHGP) Income Statement Analysis – Financial Results
Complete financial analysis of Norwegian Air Shuttle ASA (NWARF) income statement, including revenue, profit margins, EPS and key performance metrics. Get detailed insights into the financial performance of Norwegian Air Shuttle ASA, a leading company in the Airlines, Airports & Air Services industry within the Industrials sector.
- WISeKey International Holding AG (WSKEF) Income Statement Analysis – Financial Results
- Probe Gold Inc. (PROBF) Income Statement Analysis – Financial Results
- Gevo, Inc. (GEVO) Income Statement Analysis – Financial Results
- GTT Communications, Inc. (GTTN) Income Statement Analysis – Financial Results
- Mobeus Income & Growth 2 VCT Plc (MIG.L) Income Statement Analysis – Financial Results
Norwegian Air Shuttle ASA (NWARF)
About Norwegian Air Shuttle ASA
Norwegian Air Shuttle ASA, together with its subsidiaries, provides scheduled and charter airline services in Norway and internationally. As of December 31, 2021, the company operated a fleet of 70 aircraft. It is also involved in aircraft financing, leasing, and ownership activities; and cargo activities. Norwegian Air Shuttle ASA was founded in 1993 and is headquartered in Fornebu, Norway.
| Metric | 2023 | 2022 | 2021 | 2020 | 2019 | 2018 | 2017 | 2016 | 2015 | 2014 | 2013 | 2012 | 2011 | 2010 | 2009 | 2008 | 2007 | 2006 | 2005 | 2004 | 2003 | 2002 |
|---|---|---|---|---|---|---|---|---|---|---|---|---|---|---|---|---|---|---|---|---|---|---|
| Revenue | 25.54B | 18.87B | 5.07B | 9.10B | 43.52B | 40.27B | 30.95B | 26.05B | 22.49B | 19.54B | 15.58B | 12.86B | 10.53B | 8.41B | 7.31B | 6.23B | 4.23B | 2.94B | 1.97B | 1.21B | 958.61M | 386.48M |
| Cost of Revenue | 20.10B | 16.97B | 6.81B | 14.49B | 38.66B | 40.42B | 29.80B | 22.53B | 19.79B | 18.85B | 14.04B | 11.31B | 7.82B | 6.30B | 4.94B | 4.89B | 2.85B | 2.12B | 1.01B | 726.46M | 0.00 | 0.00 |
| Gross Profit | 5.44B | 1.90B | -1.75B | -5.40B | 4.86B | -152.20M | 1.15B | 3.52B | 2.70B | 691.90M | 1.54B | 1.55B | 2.71B | 2.10B | 2.37B | 1.33B | 1.37B | 823.69M | 966.23M | 483.60M | 958.61M | 386.48M |
| Gross Profit Ratio | 21.29% | 10.07% | -34.46% | -59.33% | 11.17% | -0.38% | 3.72% | 13.52% | 11.99% | 3.54% | 9.89% | 12.05% | 25.74% | 25.04% | 32.44% | 21.42% | 32.47% | 28.00% | 48.99% | 39.96% | 100.00% | 100.00% |
| Research & Development | 0.00 | 0.00 | 0.00 | 0.00 | 0.00 | 0.00 | 0.00 | 0.00 | 0.00 | 0.00 | 0.00 | 0.00 | 0.00 | 0.00 | 0.00 | 0.00 | 0.00 | 0.00 | 0.00 | 0.00 | 0.00 | 0.00 |
| General & Administrative | 917.50M | 742.30M | 901.80M | 1.17B | 2.00B | 1.92B | 0.00 | 0.00 | 0.00 | 0.00 | 0.00 | 0.00 | 0.00 | 0.00 | 0.00 | 4.89B | -91.87M | -92.37M | 132.67M | 64.20M | 925.42M | 406.59M |
| Selling & Marketing | 716.30M | 576.50M | 165.30M | 274.20M | 1.07B | 878.50M | 946.07M | 758.70M | 612.29M | 469.11M | 339.38M | 274.95M | 198.93M | 0.00 | 0.00 | 0.00 | 94.16M | 92.89M | 75.11M | 88.05M | 0.00 | 0.00 |
| SG&A | 1.63B | 1.32B | 1.07B | 1.45B | 3.07B | 878.50M | 946.07M | 758.70M | 612.29M | 469.11M | 339.38M | 274.95M | 198.93M | 0.00 | 0.00 | 4.89B | 2.29M | 515.00K | 207.79M | 152.25M | 925.42M | 406.59M |
| Other Expenses | 1.57B | 1.19B | 710.00M | 1.11B | 1.78B | 695.60M | 0.00 | 0.00 | 0.00 | 0.00 | 0.00 | 0.00 | 0.00 | 0.00 | 0.00 | 0.00 | 3.64M | 0.00 | 0.00 | 0.00 | 0.00 | 0.00 |
| Operating Expenses | 3.20B | 2.50B | 1.78B | 2.55B | 4.85B | 2.70B | 2.93B | 2.28B | 1.88B | 1.52B | 1.07B | 809.29M | 2.60B | 1.89B | 1.80B | 6.56B | 1.24B | 854.20M | 936.95M | 642.15M | 1.02B | 460.27M |
| Cost & Expenses | 23.31B | 19.47B | 8.59B | 17.04B | 43.51B | 43.12B | 32.73B | 24.81B | 21.67B | 20.37B | 15.11B | 12.12B | 10.42B | 8.20B | 6.74B | 6.56B | 4.09B | 2.97B | 1.94B | 1.37B | 1.02B | 460.27M |
| Interest Income | 231.30M | 72.60M | 13.70M | 68.20M | 204.50M | 117.50M | 71.30M | 43.63M | 74.18M | 196.27M | 149.66M | 47.54M | 35.67M | 0.00 | 0.00 | 0.00 | 21.83M | 6.80M | 4.01M | 4.33M | 3.75M | 2.44M |
| Interest Expense | 848.00M | 650.00M | 682.30M | 2.69B | 3.11B | 1.16B | 958.62M | 685.99M | 463.35M | 447.24M | 256.70M | 118.85M | 70.25M | 0.00 | 0.00 | 0.00 | 19.14M | 609.00K | 648.00K | 844.00K | 0.00 | 0.00 |
| Depreciation & Amortization | 3.53B | 1.85B | 1.27B | 6.20B | 6.46B | 1.67B | 1.41B | 1.30B | 1.13B | 748.14M | 529.83M | 385.24M | 293.95M | 186.71M | 148.88M | 129.61M | 74.04M | 51.07M | 29.32M | 19.00M | 34.37M | 5.81M |
| EBITDA | 6.19B | 933.80M | -1.92B | -13.23B | 6.92B | 337.00M | -198.50M | 2.89B | 1.67B | -618.29M | 1.22B | 1.13B | 530.74M | 396.88M | 720.75M | -208.24M | 208.00M | 19.97M | 68.90M | -132.61M | -23.82M | -67.98M |
| EBITDA Ratio | 24.22% | 4.95% | -37.95% | -35.25% | 15.91% | 3.56% | -1.26% | 11.10% | 11.95% | 0.20% | 6.22% | 11.10% | 3.84% | 4.72% | 9.86% | -3.34% | 4.62% | 0.68% | 3.49% | -10.87% | -2.49% | -17.59% |
| Operating Income | 2.23B | -468.50M | -2.79B | -23.77B | 467.00M | -3.85B | -2.00B | 1.82B | 347.78M | -1.41B | 969.66M | 403.45M | 415.93M | 210.17M | 571.87M | -337.85M | 133.95M | -30.51M | 29.28M | -159.60M | -58.19M | -73.79M |
| Operating Income Ratio | 8.74% | -2.48% | -54.97% | -261.32% | 1.07% | -9.56% | -6.47% | 6.99% | 1.55% | -7.22% | 6.22% | 3.14% | 3.95% | 2.50% | 7.82% | -5.43% | 3.17% | -1.04% | 1.48% | -13.19% | -6.07% | -19.09% |
| Total Other Income/Expenses | -428.20M | -455.80M | 4.66B | 1.64B | -2.54B | 1.36B | -560.10M | -312.05M | -272.74M | -216.51M | -532.28M | 225.33M | -249.39M | 32.93M | 51.17M | 343.19M | -20.97M | -1.20M | 9.66M | 7.14M | 15.44M | 21.93M |
| Income Before Tax | 1.80B | 1.05B | 1.88B | -22.13B | -1.69B | -2.49B | -2.56B | 1.51B | 75.04M | -1.63B | 437.38M | 623.18M | 166.54M | 243.10M | 623.04M | 5.34M | 112.98M | -31.71M | 38.94M | -152.46M | -42.75M | -51.86M |
| Income Before Tax Ratio | 7.06% | 5.55% | 37.02% | -243.34% | -3.88% | -6.18% | -8.28% | 5.79% | 0.33% | -8.33% | 2.81% | 4.85% | 1.58% | 2.89% | 8.52% | 0.09% | 2.67% | -1.08% | 1.97% | -12.60% | -4.46% | -13.42% |
| Income Tax Expense | 66.90M | 41.00M | 5.50M | 906.80M | -78.50M | -1.04B | -768.50M | 373.35M | -171.11M | -557.28M | 115.82M | 166.54M | 44.42M | 72.21M | 176.79M | 1.39M | 28.40M | -9.71M | 10.96M | -42.62M | 16.27M | 19.89M |
| Net Income | 1.74B | 1.01B | 1.87B | -23.04B | -1.61B | -1.46B | -1.79B | 1.14B | 246.15M | -1.07B | 321.56M | 456.65M | 122.13M | 170.88M | 446.25M | 3.94M | 84.58M | -22.00M | 27.98M | -109.84M | -42.75M | -51.86M |
| Net Income Ratio | 6.80% | 5.33% | 36.91% | -253.31% | -3.70% | -3.63% | -5.80% | 4.36% | 1.09% | -5.47% | 2.06% | 3.55% | 1.16% | 2.03% | 6.11% | 0.06% | 2.00% | -0.75% | 1.42% | -9.08% | -4.46% | -13.42% |
| EPS | 1.43 | 0.99 | 3.58 | -477.22 | -587.67 | -923.80 | -7.75K | 847.35 | 186.55 | -811.96 | 244.20 | 349.08 | 94.21 | 132.64 | 347.21 | 4.00 | 100.61 | -30.40 | 40.83 | -160.85 | -108.12 | -200.19 |
| EPS Diluted | 1.43 | 0.82 | 2.68 | -477.22 | -587.67 | -923.80 | -7.75K | 847.35 | 186.55 | -797.78 | 244.20 | 349.08 | 94.21 | 129.97 | 344.01 | 4.00 | 100.61 | -30.17 | 40.83 | -159.57 | -108.12 | -200.19 |
| Weighted Avg Shares Out | 1.13B | 929.58M | 522.79M | 48.28M | 2.74M | 1.58M | 231.47K | 1.34M | 1.32M | 1.32M | 1.32M | 1.31M | 1.30M | 1.28M | 1.22M | 956.46K | 756.74K | 723.64K | 685.11K | 682.88K | 395.34K | 259.05K |
| Weighted Avg Shares Out (Dil) | 1.13B | 1.13B | 698.55M | 48.28M | 2.74M | 1.58M | 231.47K | 1.35M | 1.33M | 1.34M | 1.34M | 1.32M | 1.32M | 1.31M | 1.25M | 1.02M | 780.53K | 729.03K | 686.34K | 688.35K | 395.34K | 259.05K |
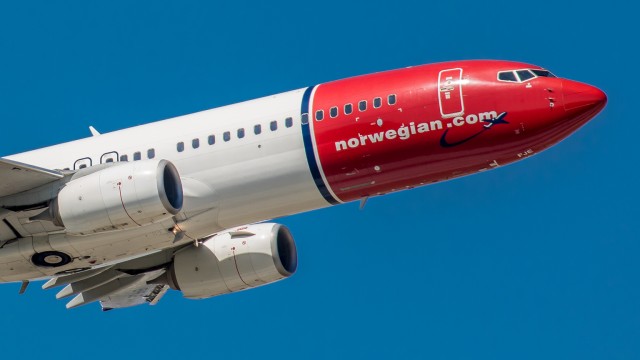
Norwegian Air Shuttle: A Speculative Buy On Growth Drivers

Norwegian buys 50 Boeing 737 MAX, ending dispute
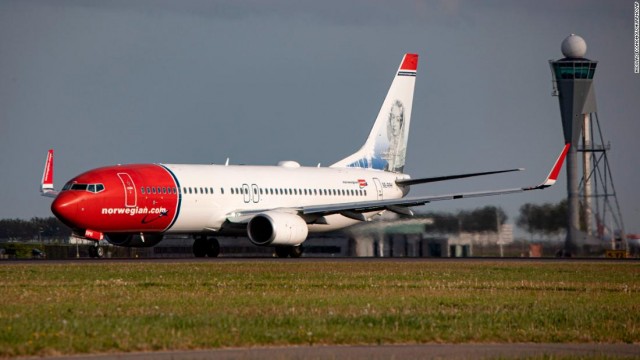
Norwegian settles dispute with Boeing and buys 50 737 Max jets
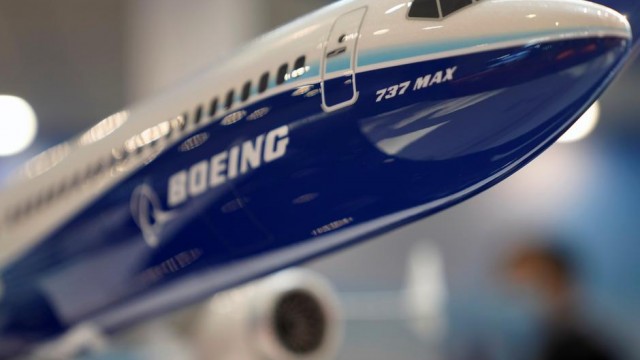
Norwegian Air orders 50 Boeing aircraft

Norwegian Air Shuttle ASA (NWARF) CEO Geir Karlsen on Q1 2022 Results - Earnings Call Transcript
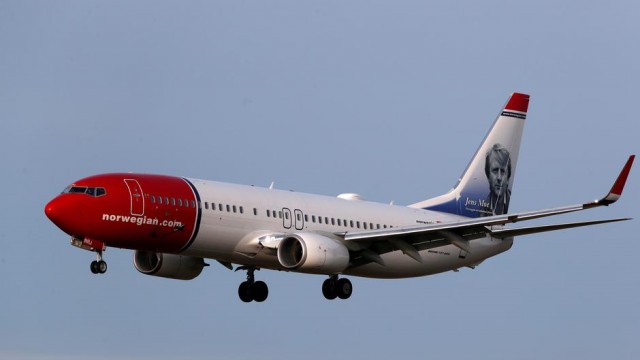
Norwegian Air posts Q1 loss, flags fuel costs to impact recovery

Norwegian Air leases 10 new Boeing MAX aircraft

Norwegian Air Shuttle ASA (NWARF) CEO Geir Karlsen on Q4 2021 Results - Earnings Call Transcript
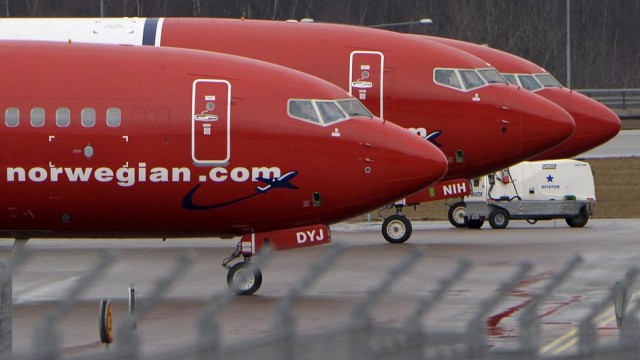
Norwegian Air CEO considers Airbus jets amid drawn-out Boeing litigation
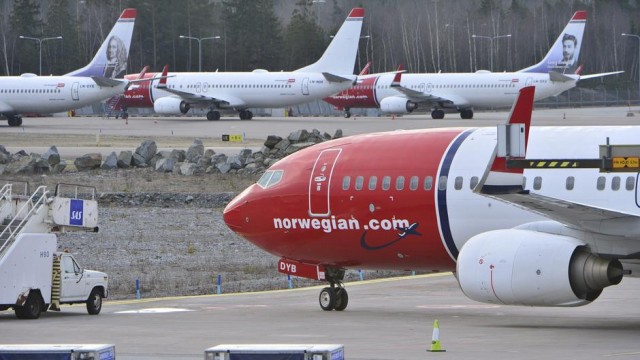
Norwegian Air swings to profit after restructuring
Source: https://incomestatements.info
Category: Stock Reports
