See more : Anfield Energy Inc. (ANLDF) Income Statement Analysis – Financial Results
Complete financial analysis of Norwegian Air Shuttle ASA (NWARF) income statement, including revenue, profit margins, EPS and key performance metrics. Get detailed insights into the financial performance of Norwegian Air Shuttle ASA, a leading company in the Airlines, Airports & Air Services industry within the Industrials sector.
- East Imperial PLC (EISB.L) Income Statement Analysis – Financial Results
- Budweiser Brewing Company APAC Limited (BDWBF) Income Statement Analysis – Financial Results
- Gould Investors L.P. (GDVTZ) Income Statement Analysis – Financial Results
- Coveo Solutions Inc. (CVO.TO) Income Statement Analysis – Financial Results
- Shanghai Morn Electric Equipment Co., Ltd. (002451.SZ) Income Statement Analysis – Financial Results
Norwegian Air Shuttle ASA (NWARF)
About Norwegian Air Shuttle ASA
Norwegian Air Shuttle ASA, together with its subsidiaries, provides scheduled and charter airline services in Norway and internationally. As of December 31, 2021, the company operated a fleet of 70 aircraft. It is also involved in aircraft financing, leasing, and ownership activities; and cargo activities. Norwegian Air Shuttle ASA was founded in 1993 and is headquartered in Fornebu, Norway.
| Metric | 2023 | 2022 | 2021 | 2020 | 2019 | 2018 | 2017 | 2016 | 2015 | 2014 | 2013 | 2012 | 2011 | 2010 | 2009 | 2008 | 2007 | 2006 | 2005 | 2004 | 2003 | 2002 |
|---|---|---|---|---|---|---|---|---|---|---|---|---|---|---|---|---|---|---|---|---|---|---|
| Revenue | 25.54B | 18.87B | 5.07B | 9.10B | 43.52B | 40.27B | 30.95B | 26.05B | 22.49B | 19.54B | 15.58B | 12.86B | 10.53B | 8.41B | 7.31B | 6.23B | 4.23B | 2.94B | 1.97B | 1.21B | 958.61M | 386.48M |
| Cost of Revenue | 20.10B | 16.97B | 6.81B | 14.49B | 38.66B | 40.42B | 29.80B | 22.53B | 19.79B | 18.85B | 14.04B | 11.31B | 7.82B | 6.30B | 4.94B | 4.89B | 2.85B | 2.12B | 1.01B | 726.46M | 0.00 | 0.00 |
| Gross Profit | 5.44B | 1.90B | -1.75B | -5.40B | 4.86B | -152.20M | 1.15B | 3.52B | 2.70B | 691.90M | 1.54B | 1.55B | 2.71B | 2.10B | 2.37B | 1.33B | 1.37B | 823.69M | 966.23M | 483.60M | 958.61M | 386.48M |
| Gross Profit Ratio | 21.29% | 10.07% | -34.46% | -59.33% | 11.17% | -0.38% | 3.72% | 13.52% | 11.99% | 3.54% | 9.89% | 12.05% | 25.74% | 25.04% | 32.44% | 21.42% | 32.47% | 28.00% | 48.99% | 39.96% | 100.00% | 100.00% |
| Research & Development | 0.00 | 0.00 | 0.00 | 0.00 | 0.00 | 0.00 | 0.00 | 0.00 | 0.00 | 0.00 | 0.00 | 0.00 | 0.00 | 0.00 | 0.00 | 0.00 | 0.00 | 0.00 | 0.00 | 0.00 | 0.00 | 0.00 |
| General & Administrative | 917.50M | 742.30M | 901.80M | 1.17B | 2.00B | 1.92B | 0.00 | 0.00 | 0.00 | 0.00 | 0.00 | 0.00 | 0.00 | 0.00 | 0.00 | 4.89B | -91.87M | -92.37M | 132.67M | 64.20M | 925.42M | 406.59M |
| Selling & Marketing | 716.30M | 576.50M | 165.30M | 274.20M | 1.07B | 878.50M | 946.07M | 758.70M | 612.29M | 469.11M | 339.38M | 274.95M | 198.93M | 0.00 | 0.00 | 0.00 | 94.16M | 92.89M | 75.11M | 88.05M | 0.00 | 0.00 |
| SG&A | 1.63B | 1.32B | 1.07B | 1.45B | 3.07B | 878.50M | 946.07M | 758.70M | 612.29M | 469.11M | 339.38M | 274.95M | 198.93M | 0.00 | 0.00 | 4.89B | 2.29M | 515.00K | 207.79M | 152.25M | 925.42M | 406.59M |
| Other Expenses | 1.57B | 1.19B | 710.00M | 1.11B | 1.78B | 695.60M | 0.00 | 0.00 | 0.00 | 0.00 | 0.00 | 0.00 | 0.00 | 0.00 | 0.00 | 0.00 | 3.64M | 0.00 | 0.00 | 0.00 | 0.00 | 0.00 |
| Operating Expenses | 3.20B | 2.50B | 1.78B | 2.55B | 4.85B | 2.70B | 2.93B | 2.28B | 1.88B | 1.52B | 1.07B | 809.29M | 2.60B | 1.89B | 1.80B | 6.56B | 1.24B | 854.20M | 936.95M | 642.15M | 1.02B | 460.27M |
| Cost & Expenses | 23.31B | 19.47B | 8.59B | 17.04B | 43.51B | 43.12B | 32.73B | 24.81B | 21.67B | 20.37B | 15.11B | 12.12B | 10.42B | 8.20B | 6.74B | 6.56B | 4.09B | 2.97B | 1.94B | 1.37B | 1.02B | 460.27M |
| Interest Income | 231.30M | 72.60M | 13.70M | 68.20M | 204.50M | 117.50M | 71.30M | 43.63M | 74.18M | 196.27M | 149.66M | 47.54M | 35.67M | 0.00 | 0.00 | 0.00 | 21.83M | 6.80M | 4.01M | 4.33M | 3.75M | 2.44M |
| Interest Expense | 848.00M | 650.00M | 682.30M | 2.69B | 3.11B | 1.16B | 958.62M | 685.99M | 463.35M | 447.24M | 256.70M | 118.85M | 70.25M | 0.00 | 0.00 | 0.00 | 19.14M | 609.00K | 648.00K | 844.00K | 0.00 | 0.00 |
| Depreciation & Amortization | 3.53B | 1.85B | 1.27B | 6.20B | 6.46B | 1.67B | 1.41B | 1.30B | 1.13B | 748.14M | 529.83M | 385.24M | 293.95M | 186.71M | 148.88M | 129.61M | 74.04M | 51.07M | 29.32M | 19.00M | 34.37M | 5.81M |
| EBITDA | 6.19B | 933.80M | -1.92B | -13.23B | 6.92B | 337.00M | -198.50M | 2.89B | 1.67B | -618.29M | 1.22B | 1.13B | 530.74M | 396.88M | 720.75M | -208.24M | 208.00M | 19.97M | 68.90M | -132.61M | -23.82M | -67.98M |
| EBITDA Ratio | 24.22% | 4.95% | -37.95% | -35.25% | 15.91% | 3.56% | -1.26% | 11.10% | 11.95% | 0.20% | 6.22% | 11.10% | 3.84% | 4.72% | 9.86% | -3.34% | 4.62% | 0.68% | 3.49% | -10.87% | -2.49% | -17.59% |
| Operating Income | 2.23B | -468.50M | -2.79B | -23.77B | 467.00M | -3.85B | -2.00B | 1.82B | 347.78M | -1.41B | 969.66M | 403.45M | 415.93M | 210.17M | 571.87M | -337.85M | 133.95M | -30.51M | 29.28M | -159.60M | -58.19M | -73.79M |
| Operating Income Ratio | 8.74% | -2.48% | -54.97% | -261.32% | 1.07% | -9.56% | -6.47% | 6.99% | 1.55% | -7.22% | 6.22% | 3.14% | 3.95% | 2.50% | 7.82% | -5.43% | 3.17% | -1.04% | 1.48% | -13.19% | -6.07% | -19.09% |
| Total Other Income/Expenses | -428.20M | -455.80M | 4.66B | 1.64B | -2.54B | 1.36B | -560.10M | -312.05M | -272.74M | -216.51M | -532.28M | 225.33M | -249.39M | 32.93M | 51.17M | 343.19M | -20.97M | -1.20M | 9.66M | 7.14M | 15.44M | 21.93M |
| Income Before Tax | 1.80B | 1.05B | 1.88B | -22.13B | -1.69B | -2.49B | -2.56B | 1.51B | 75.04M | -1.63B | 437.38M | 623.18M | 166.54M | 243.10M | 623.04M | 5.34M | 112.98M | -31.71M | 38.94M | -152.46M | -42.75M | -51.86M |
| Income Before Tax Ratio | 7.06% | 5.55% | 37.02% | -243.34% | -3.88% | -6.18% | -8.28% | 5.79% | 0.33% | -8.33% | 2.81% | 4.85% | 1.58% | 2.89% | 8.52% | 0.09% | 2.67% | -1.08% | 1.97% | -12.60% | -4.46% | -13.42% |
| Income Tax Expense | 66.90M | 41.00M | 5.50M | 906.80M | -78.50M | -1.04B | -768.50M | 373.35M | -171.11M | -557.28M | 115.82M | 166.54M | 44.42M | 72.21M | 176.79M | 1.39M | 28.40M | -9.71M | 10.96M | -42.62M | 16.27M | 19.89M |
| Net Income | 1.74B | 1.01B | 1.87B | -23.04B | -1.61B | -1.46B | -1.79B | 1.14B | 246.15M | -1.07B | 321.56M | 456.65M | 122.13M | 170.88M | 446.25M | 3.94M | 84.58M | -22.00M | 27.98M | -109.84M | -42.75M | -51.86M |
| Net Income Ratio | 6.80% | 5.33% | 36.91% | -253.31% | -3.70% | -3.63% | -5.80% | 4.36% | 1.09% | -5.47% | 2.06% | 3.55% | 1.16% | 2.03% | 6.11% | 0.06% | 2.00% | -0.75% | 1.42% | -9.08% | -4.46% | -13.42% |
| EPS | 1.43 | 0.99 | 3.58 | -477.22 | -587.67 | -923.80 | -7.75K | 847.35 | 186.55 | -811.96 | 244.20 | 349.08 | 94.21 | 132.64 | 347.21 | 4.00 | 100.61 | -30.40 | 40.83 | -160.85 | -108.12 | -200.19 |
| EPS Diluted | 1.43 | 0.82 | 2.68 | -477.22 | -587.67 | -923.80 | -7.75K | 847.35 | 186.55 | -797.78 | 244.20 | 349.08 | 94.21 | 129.97 | 344.01 | 4.00 | 100.61 | -30.17 | 40.83 | -159.57 | -108.12 | -200.19 |
| Weighted Avg Shares Out | 1.13B | 929.58M | 522.79M | 48.28M | 2.74M | 1.58M | 231.47K | 1.34M | 1.32M | 1.32M | 1.32M | 1.31M | 1.30M | 1.28M | 1.22M | 956.46K | 756.74K | 723.64K | 685.11K | 682.88K | 395.34K | 259.05K |
| Weighted Avg Shares Out (Dil) | 1.13B | 1.13B | 698.55M | 48.28M | 2.74M | 1.58M | 231.47K | 1.35M | 1.33M | 1.34M | 1.34M | 1.32M | 1.32M | 1.31M | 1.25M | 1.02M | 780.53K | 729.03K | 686.34K | 688.35K | 395.34K | 259.05K |
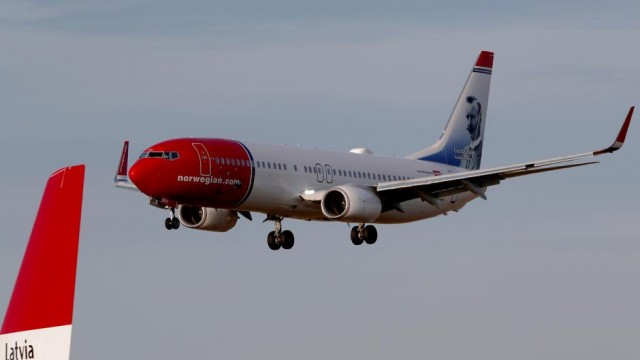
Norwegian Air sees no deal with Boeing before reconstruction over, CFO says

Norwegian Air and Airbus agree terms to end jet deliveries, court is told

Norwegian Air Shuttle: Clearer Skies Ahead
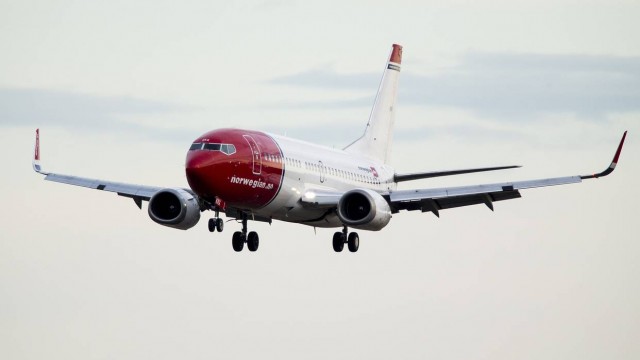
Norwegian Air Scraps Long-Haul Network in Covid-19 Recovery Plan
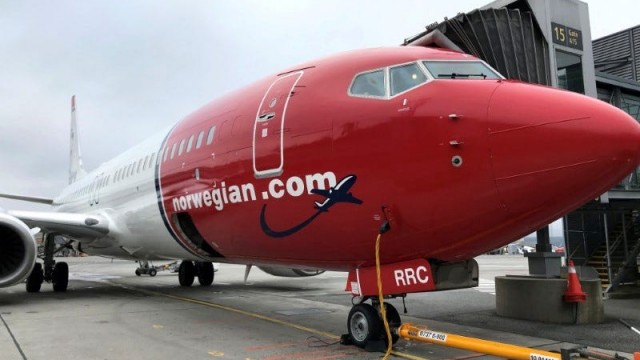
Norwegian Air abandons long-haul flights, ending its $100 travel between the US and Europe

Norwegian Air Shuttle shares jump 80%
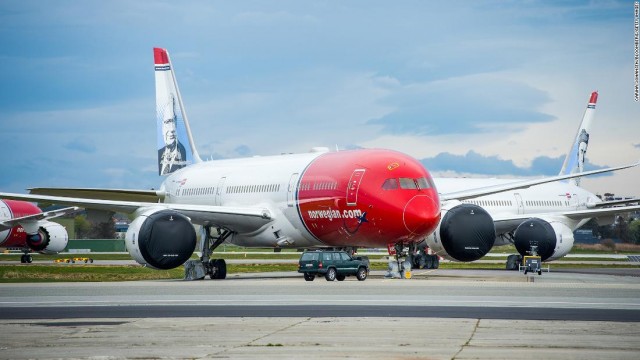
Norwegian Air has filed for bankruptcy

Norwegian Air says it could run out of cash in early 2021
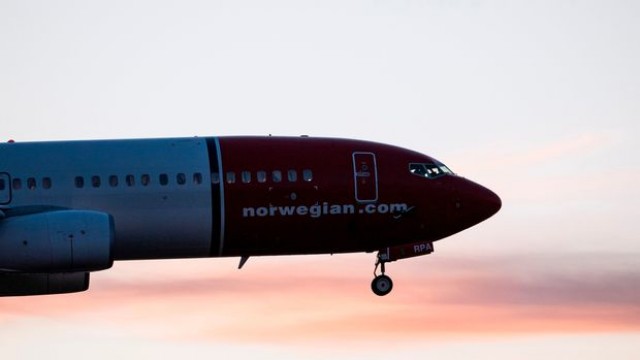
Norwegian Air stock plunges as government turns back on cash-strapped airline

Timeline: Norwegian Air's rise and battle for survival
Source: https://incomestatements.info
Category: Stock Reports
