See more : Groupe Partouche SA (PARP.PA) Income Statement Analysis – Financial Results
Complete financial analysis of Royal Helium Ltd. (RHCCF) income statement, including revenue, profit margins, EPS and key performance metrics. Get detailed insights into the financial performance of Royal Helium Ltd., a leading company in the Oil & Gas Exploration & Production industry within the Energy sector.
- BEML Land Assets Limited (BLAL.NS) Income Statement Analysis – Financial Results
- Silver Spike Investment Corp. (SSIC) Income Statement Analysis – Financial Results
- Tejas Networks Limited (TEJASNET.NS) Income Statement Analysis – Financial Results
- International Flavors & Fragrances Inc. (IFFT) Income Statement Analysis – Financial Results
- CF Acquisition Corp. VI (CFVIU) Income Statement Analysis – Financial Results
Royal Helium Ltd. (RHCCF)
About Royal Helium Ltd.
Royal Helium Ltd. engages in the exploration and development of helium properties in Canada. It holds approximately 348,908 hectares of prospective helium lands in southern Saskatchewan. The company is headquartered in Saskatoon, Canada.
| Metric | 2023 | 2022 | 2021 | 2020 | 2019 | 2018 | 2017 | 2016 | 2015 | 2014 | 2013 |
|---|---|---|---|---|---|---|---|---|---|---|---|
| Revenue | 98.16K | 0.00 | 0.00 | 0.00 | 0.00 | 0.00 | 0.00 | 605.69K | 3.05M | 3.90M | 2.82M |
| Cost of Revenue | 946.97K | 0.00 | 0.00 | 0.00 | 0.00 | 0.00 | 0.00 | 298.18K | 1.66M | 1.72M | 1.25M |
| Gross Profit | -848.81K | 0.00 | 0.00 | 0.00 | 0.00 | 0.00 | 0.00 | 307.51K | 1.39M | 2.18M | 1.58M |
| Gross Profit Ratio | -864.70% | 0.00% | 0.00% | 0.00% | 0.00% | 0.00% | 0.00% | 50.77% | 45.52% | 55.84% | 55.86% |
| Research & Development | 0.00 | 0.00 | 0.00 | 0.00 | 0.00 | 0.00 | 0.00 | 0.00 | 0.00 | 0.00 | 0.00 |
| General & Administrative | 3.97M | 4.20M | 5.16M | 1.33M | 351.66K | 707.82K | 937.47K | 2.12M | 2.64M | 2.04M | 723.12K |
| Selling & Marketing | 820.04K | 975.98K | 1.03M | 325.02K | 17.77K | 0.00 | 5.81 | 0.00 | 0.00 | 0.00 | 0.00 |
| SG&A | 4.79M | 4.20M | 5.16M | 1.33M | 351.66K | 707.82K | 937.47K | 2.12M | 2.64M | 2.04M | 723.12K |
| Other Expenses | -5.64M | 0.00 | 4.18K | 3.05K | 112.15K | 10.11K | 0.00 | 1.13M | 0.00 | 0.00 | 0.00 |
| Operating Expenses | -848.81K | 4.20M | 5.16M | 1.33M | 351.66K | 707.82K | 937.47K | 2.12M | 4.88M | 3.84M | 2.47M |
| Cost & Expenses | 8.60M | 4.20M | 5.16M | 1.33M | 351.66K | 707.82K | 937.47K | 2.42M | 6.55M | 5.56M | 3.71M |
| Interest Income | 51.61K | 0.00 | 32.19K | 0.00 | 0.00 | 0.00 | 0.00 | 13.42K | 38.21K | 26.95K | 18.29K |
| Interest Expense | 2.59M | 0.00 | 0.00 | 0.00 | 0.00 | 0.00 | 0.00 | 0.00 | 0.00 | 0.00 | 0.00 |
| Depreciation & Amortization | 941.33K | 9.55K | 4.13M | 1.01M | 333.90K | 707.82K | 995.88K | 4.57M | 2.23M | 1.58M | 1.71M |
| EBITDA | -7.52M | -4.19M | -991.65K | -321.97K | 94.38K | 10.11K | 224.32K | 2.75M | 6.19M | -86.20K | 819.98K |
| EBITDA Ratio | -7,655.98% | 0.00% | 0.00% | 0.00% | 0.00% | 0.00% | 0.00% | 454.25% | 202.76% | -2.21% | 144.98% |
| Operating Income | -8.06M | -4.01M | -5.16M | -1.33M | -351.66K | -707.82K | -937.47K | -1.81M | -17.39M | -1.66M | -4.18M |
| Operating Income Ratio | -8,207.15% | 0.00% | 0.00% | 0.00% | 0.00% | 0.00% | 0.00% | -299.60% | -569.37% | -42.63% | -148.09% |
| Total Other Income/Expenses | -2.99M | -190.00K | -991.65K | 3.05K | 94.38K | 10.11K | 211.16K | -4.55M | 6.48M | 3.31M | 36.01K |
| Income Before Tax | -11.04M | -4.39M | -5.13M | -1.33M | -239.51K | -697.71K | -726.31K | -6.37M | -10.91M | -1.63M | -4.15M |
| Income Before Tax Ratio | -11,250.41% | 0.00% | 0.00% | 0.00% | 0.00% | 0.00% | 0.00% | -1,051.23% | -357.29% | -41.88% | -146.81% |
| Income Tax Expense | 0.00 | 189.99K | -36.33K | -1.01K | -333.90 | 1.70M | 0.00 | -13.42K | 7.42M | 107.06K | -80.75K |
| Net Income | -11.04M | -4.39M | -5.13M | -1.33M | -239.51K | -2.40M | -726.31K | -6.37M | -10.91M | -1.74M | -4.07M |
| Net Income Ratio | -11,250.41% | 0.00% | 0.00% | 0.00% | 0.00% | 0.00% | 0.00% | -1,051.23% | -357.29% | -44.63% | -143.95% |
| EPS | -0.04 | -0.02 | -0.04 | -0.03 | -0.01 | -0.08 | -0.05 | -0.42 | -0.74 | -0.16 | -0.47 |
| EPS Diluted | -0.04 | -0.02 | -0.04 | -0.03 | -0.01 | -0.08 | -0.05 | -0.42 | -0.74 | -0.16 | -0.47 |
| Weighted Avg Shares Out | 246.65M | 177.99M | 123.30M | 47.12M | 33.67M | 30.21M | 15.54M | 15.01M | 14.76M | 11.00M | 8.65M |
| Weighted Avg Shares Out (Dil) | 246.65M | 177.99M | 123.30M | 47.12M | 33.67M | 30.21M | 15.54M | 15.01M | 14.76M | 11.00M | 8.65M |

Royal Helium Announces $6 Million Bought Deal Public Offering of Units for Drilling of High-Impact Appraisal Well at 40 Mile and Continued Advancement in Saskatchewan Helium Corridor

Royal Helium unveils $25mln JV funding deal with Sparrow Hawk

Royal Helium unveils $25mln JV funding deal with Sparrow Hawk
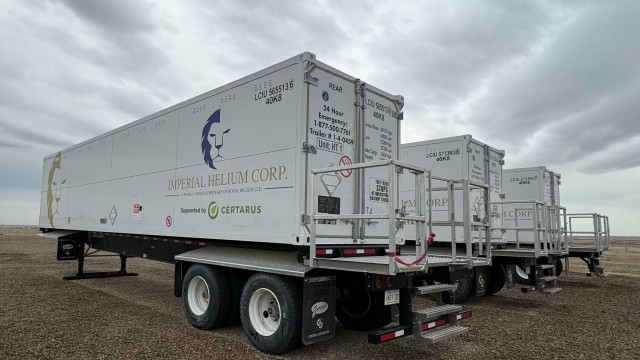
Royal Helium inks first offtake deal for food-grade CO2 from Steveville facility
Royal Helium CEO talks 2024 plans focused on well testing and expansion across Saskatchewan and Alberta assets
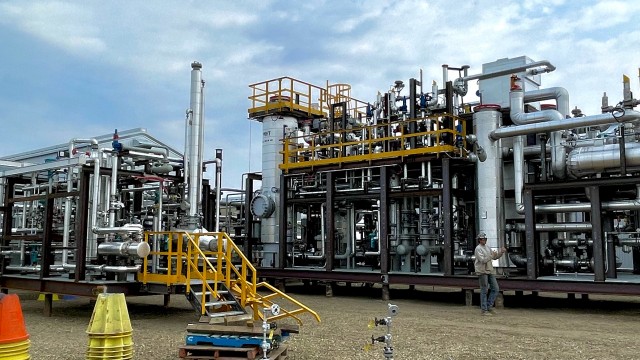
Royal Helium secures C$3M government boost for Steveville facility enhancement

Royal Helium appoints business veteran David Young as its new president
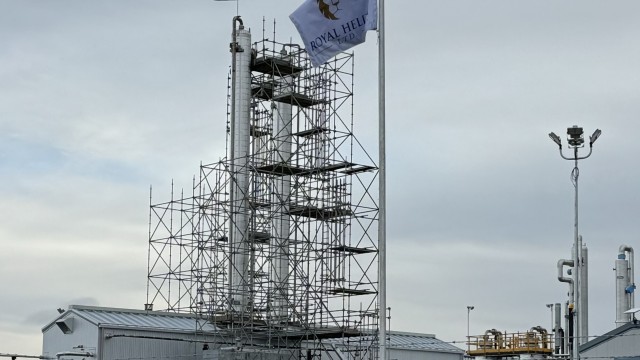
Royal Helium secures C$3.6M expansion in debt facilities
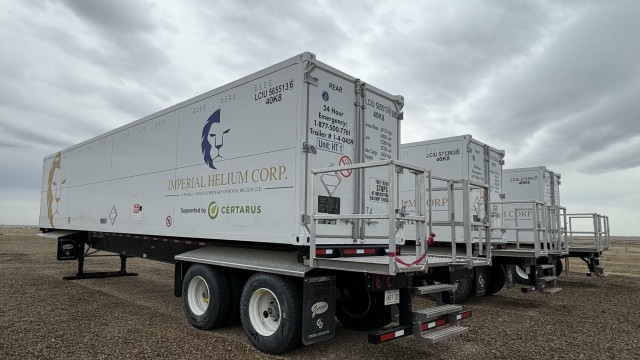
Royal Helium begins purified helium deliveries to first end user in US
Royal Helium holds official inauguration of Steveville purification facility
Source: https://incomestatements.info
Category: Stock Reports
