See more : Andean Precious Metals Corp. (APM.V) Income Statement Analysis – Financial Results
Complete financial analysis of Royal Helium Ltd. (RHCCF) income statement, including revenue, profit margins, EPS and key performance metrics. Get detailed insights into the financial performance of Royal Helium Ltd., a leading company in the Oil & Gas Exploration & Production industry within the Energy sector.
- Central Bank of India (CENTRALBK.NS) Income Statement Analysis – Financial Results
- GIC Housing Finance Limited (GICHSGFIN.NS) Income Statement Analysis – Financial Results
- Ascot Corp. (3264.T) Income Statement Analysis – Financial Results
- Danieli & C. Officine Meccaniche S.p.A. (DNIYY) Income Statement Analysis – Financial Results
- Arihant’s Securities Limited (ARISE.BO) Income Statement Analysis – Financial Results
Royal Helium Ltd. (RHCCF)
About Royal Helium Ltd.
Royal Helium Ltd. engages in the exploration and development of helium properties in Canada. It holds approximately 348,908 hectares of prospective helium lands in southern Saskatchewan. The company is headquartered in Saskatoon, Canada.
| Metric | 2023 | 2022 | 2021 | 2020 | 2019 | 2018 | 2017 | 2016 | 2015 | 2014 | 2013 |
|---|---|---|---|---|---|---|---|---|---|---|---|
| Revenue | 98.16K | 0.00 | 0.00 | 0.00 | 0.00 | 0.00 | 0.00 | 605.69K | 3.05M | 3.90M | 2.82M |
| Cost of Revenue | 946.97K | 0.00 | 0.00 | 0.00 | 0.00 | 0.00 | 0.00 | 298.18K | 1.66M | 1.72M | 1.25M |
| Gross Profit | -848.81K | 0.00 | 0.00 | 0.00 | 0.00 | 0.00 | 0.00 | 307.51K | 1.39M | 2.18M | 1.58M |
| Gross Profit Ratio | -864.70% | 0.00% | 0.00% | 0.00% | 0.00% | 0.00% | 0.00% | 50.77% | 45.52% | 55.84% | 55.86% |
| Research & Development | 0.00 | 0.00 | 0.00 | 0.00 | 0.00 | 0.00 | 0.00 | 0.00 | 0.00 | 0.00 | 0.00 |
| General & Administrative | 3.97M | 4.20M | 5.16M | 1.33M | 351.66K | 707.82K | 937.47K | 2.12M | 2.64M | 2.04M | 723.12K |
| Selling & Marketing | 820.04K | 975.98K | 1.03M | 325.02K | 17.77K | 0.00 | 5.81 | 0.00 | 0.00 | 0.00 | 0.00 |
| SG&A | 4.79M | 4.20M | 5.16M | 1.33M | 351.66K | 707.82K | 937.47K | 2.12M | 2.64M | 2.04M | 723.12K |
| Other Expenses | -5.64M | 0.00 | 4.18K | 3.05K | 112.15K | 10.11K | 0.00 | 1.13M | 0.00 | 0.00 | 0.00 |
| Operating Expenses | -848.81K | 4.20M | 5.16M | 1.33M | 351.66K | 707.82K | 937.47K | 2.12M | 4.88M | 3.84M | 2.47M |
| Cost & Expenses | 8.60M | 4.20M | 5.16M | 1.33M | 351.66K | 707.82K | 937.47K | 2.42M | 6.55M | 5.56M | 3.71M |
| Interest Income | 51.61K | 0.00 | 32.19K | 0.00 | 0.00 | 0.00 | 0.00 | 13.42K | 38.21K | 26.95K | 18.29K |
| Interest Expense | 2.59M | 0.00 | 0.00 | 0.00 | 0.00 | 0.00 | 0.00 | 0.00 | 0.00 | 0.00 | 0.00 |
| Depreciation & Amortization | 941.33K | 9.55K | 4.13M | 1.01M | 333.90K | 707.82K | 995.88K | 4.57M | 2.23M | 1.58M | 1.71M |
| EBITDA | -7.52M | -4.19M | -991.65K | -321.97K | 94.38K | 10.11K | 224.32K | 2.75M | 6.19M | -86.20K | 819.98K |
| EBITDA Ratio | -7,655.98% | 0.00% | 0.00% | 0.00% | 0.00% | 0.00% | 0.00% | 454.25% | 202.76% | -2.21% | 144.98% |
| Operating Income | -8.06M | -4.01M | -5.16M | -1.33M | -351.66K | -707.82K | -937.47K | -1.81M | -17.39M | -1.66M | -4.18M |
| Operating Income Ratio | -8,207.15% | 0.00% | 0.00% | 0.00% | 0.00% | 0.00% | 0.00% | -299.60% | -569.37% | -42.63% | -148.09% |
| Total Other Income/Expenses | -2.99M | -190.00K | -991.65K | 3.05K | 94.38K | 10.11K | 211.16K | -4.55M | 6.48M | 3.31M | 36.01K |
| Income Before Tax | -11.04M | -4.39M | -5.13M | -1.33M | -239.51K | -697.71K | -726.31K | -6.37M | -10.91M | -1.63M | -4.15M |
| Income Before Tax Ratio | -11,250.41% | 0.00% | 0.00% | 0.00% | 0.00% | 0.00% | 0.00% | -1,051.23% | -357.29% | -41.88% | -146.81% |
| Income Tax Expense | 0.00 | 189.99K | -36.33K | -1.01K | -333.90 | 1.70M | 0.00 | -13.42K | 7.42M | 107.06K | -80.75K |
| Net Income | -11.04M | -4.39M | -5.13M | -1.33M | -239.51K | -2.40M | -726.31K | -6.37M | -10.91M | -1.74M | -4.07M |
| Net Income Ratio | -11,250.41% | 0.00% | 0.00% | 0.00% | 0.00% | 0.00% | 0.00% | -1,051.23% | -357.29% | -44.63% | -143.95% |
| EPS | -0.04 | -0.02 | -0.04 | -0.03 | -0.01 | -0.08 | -0.05 | -0.42 | -0.74 | -0.16 | -0.47 |
| EPS Diluted | -0.04 | -0.02 | -0.04 | -0.03 | -0.01 | -0.08 | -0.05 | -0.42 | -0.74 | -0.16 | -0.47 |
| Weighted Avg Shares Out | 246.65M | 177.99M | 123.30M | 47.12M | 33.67M | 30.21M | 15.54M | 15.01M | 14.76M | 11.00M | 8.65M |
| Weighted Avg Shares Out (Dil) | 246.65M | 177.99M | 123.30M | 47.12M | 33.67M | 30.21M | 15.54M | 15.01M | 14.76M | 11.00M | 8.65M |
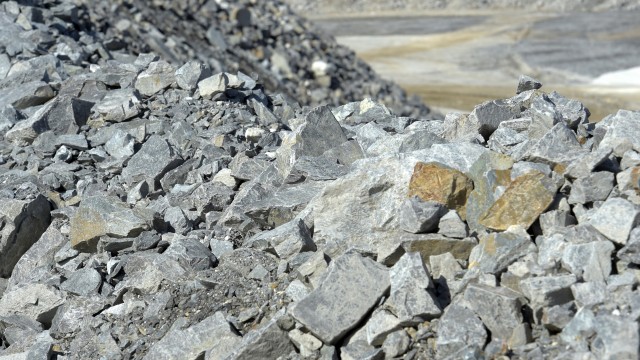
Royal Helium says it has sent lithium brine from Climax-2 in Saskatchewan for sampling
Royal Helium secures independent helium resources assessment and valuation for Steveville and Nazare
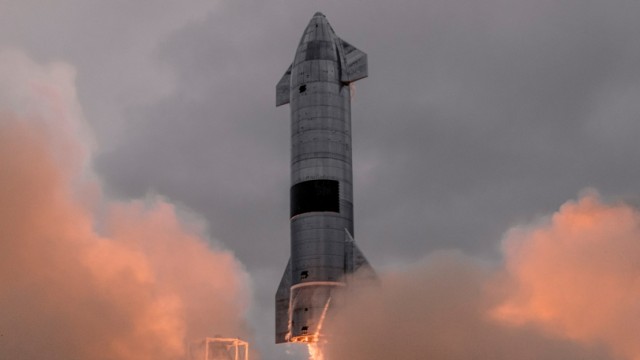
Royal Helium enters long-term agreement with a major North American space launch company for the supply of helium
Royal Helium discovers high-grade lithium in brine at Climax project in Saskatchewan

Royal Helium appoints Shayne Neigum as its chief operating officer and head of exploration

Royal Helium appoints Shayne Neigum as its chief operating officer (COO) and head of Exploration
Royal Helium finds “significant” helium shows as Val Marie-1 exploration well in Saskatchewan hits 2,596m total depth
Royal Helium gets approval for Climax/Nazare project from government of Saskatchewan
Royal Helium closes deal to acquire Imperial Helium
Royal Helium begins drilling its first well in the Val Marie field located in southwestern Saskatchewan near the Canada-US border
Source: https://incomestatements.info
Category: Stock Reports
