See more : DILA Capital Acquisition Corp. (DILA) Income Statement Analysis – Financial Results
Complete financial analysis of Royal Helium Ltd. (RHCCF) income statement, including revenue, profit margins, EPS and key performance metrics. Get detailed insights into the financial performance of Royal Helium Ltd., a leading company in the Oil & Gas Exploration & Production industry within the Energy sector.
- PT Bali Bintang Sejahtera Tbk (BOLA.JK) Income Statement Analysis – Financial Results
- HFB Financial Corporation (HFBA) Income Statement Analysis – Financial Results
- Core & Main, Inc. (CNM) Income Statement Analysis – Financial Results
- Exchange Bank (Santa Rosa, CA) (EXSR) Income Statement Analysis – Financial Results
- HH&L Acquisition Co. (HHLA-UN) Income Statement Analysis – Financial Results
Royal Helium Ltd. (RHCCF)
About Royal Helium Ltd.
Royal Helium Ltd. engages in the exploration and development of helium properties in Canada. It holds approximately 348,908 hectares of prospective helium lands in southern Saskatchewan. The company is headquartered in Saskatoon, Canada.
| Metric | 2023 | 2022 | 2021 | 2020 | 2019 | 2018 | 2017 | 2016 | 2015 | 2014 | 2013 |
|---|---|---|---|---|---|---|---|---|---|---|---|
| Revenue | 98.16K | 0.00 | 0.00 | 0.00 | 0.00 | 0.00 | 0.00 | 605.69K | 3.05M | 3.90M | 2.82M |
| Cost of Revenue | 946.97K | 0.00 | 0.00 | 0.00 | 0.00 | 0.00 | 0.00 | 298.18K | 1.66M | 1.72M | 1.25M |
| Gross Profit | -848.81K | 0.00 | 0.00 | 0.00 | 0.00 | 0.00 | 0.00 | 307.51K | 1.39M | 2.18M | 1.58M |
| Gross Profit Ratio | -864.70% | 0.00% | 0.00% | 0.00% | 0.00% | 0.00% | 0.00% | 50.77% | 45.52% | 55.84% | 55.86% |
| Research & Development | 0.00 | 0.00 | 0.00 | 0.00 | 0.00 | 0.00 | 0.00 | 0.00 | 0.00 | 0.00 | 0.00 |
| General & Administrative | 3.97M | 4.20M | 5.16M | 1.33M | 351.66K | 707.82K | 937.47K | 2.12M | 2.64M | 2.04M | 723.12K |
| Selling & Marketing | 820.04K | 975.98K | 1.03M | 325.02K | 17.77K | 0.00 | 5.81 | 0.00 | 0.00 | 0.00 | 0.00 |
| SG&A | 4.79M | 4.20M | 5.16M | 1.33M | 351.66K | 707.82K | 937.47K | 2.12M | 2.64M | 2.04M | 723.12K |
| Other Expenses | -5.64M | 0.00 | 4.18K | 3.05K | 112.15K | 10.11K | 0.00 | 1.13M | 0.00 | 0.00 | 0.00 |
| Operating Expenses | -848.81K | 4.20M | 5.16M | 1.33M | 351.66K | 707.82K | 937.47K | 2.12M | 4.88M | 3.84M | 2.47M |
| Cost & Expenses | 8.60M | 4.20M | 5.16M | 1.33M | 351.66K | 707.82K | 937.47K | 2.42M | 6.55M | 5.56M | 3.71M |
| Interest Income | 51.61K | 0.00 | 32.19K | 0.00 | 0.00 | 0.00 | 0.00 | 13.42K | 38.21K | 26.95K | 18.29K |
| Interest Expense | 2.59M | 0.00 | 0.00 | 0.00 | 0.00 | 0.00 | 0.00 | 0.00 | 0.00 | 0.00 | 0.00 |
| Depreciation & Amortization | 941.33K | 9.55K | 4.13M | 1.01M | 333.90K | 707.82K | 995.88K | 4.57M | 2.23M | 1.58M | 1.71M |
| EBITDA | -7.52M | -4.19M | -991.65K | -321.97K | 94.38K | 10.11K | 224.32K | 2.75M | 6.19M | -86.20K | 819.98K |
| EBITDA Ratio | -7,655.98% | 0.00% | 0.00% | 0.00% | 0.00% | 0.00% | 0.00% | 454.25% | 202.76% | -2.21% | 144.98% |
| Operating Income | -8.06M | -4.01M | -5.16M | -1.33M | -351.66K | -707.82K | -937.47K | -1.81M | -17.39M | -1.66M | -4.18M |
| Operating Income Ratio | -8,207.15% | 0.00% | 0.00% | 0.00% | 0.00% | 0.00% | 0.00% | -299.60% | -569.37% | -42.63% | -148.09% |
| Total Other Income/Expenses | -2.99M | -190.00K | -991.65K | 3.05K | 94.38K | 10.11K | 211.16K | -4.55M | 6.48M | 3.31M | 36.01K |
| Income Before Tax | -11.04M | -4.39M | -5.13M | -1.33M | -239.51K | -697.71K | -726.31K | -6.37M | -10.91M | -1.63M | -4.15M |
| Income Before Tax Ratio | -11,250.41% | 0.00% | 0.00% | 0.00% | 0.00% | 0.00% | 0.00% | -1,051.23% | -357.29% | -41.88% | -146.81% |
| Income Tax Expense | 0.00 | 189.99K | -36.33K | -1.01K | -333.90 | 1.70M | 0.00 | -13.42K | 7.42M | 107.06K | -80.75K |
| Net Income | -11.04M | -4.39M | -5.13M | -1.33M | -239.51K | -2.40M | -726.31K | -6.37M | -10.91M | -1.74M | -4.07M |
| Net Income Ratio | -11,250.41% | 0.00% | 0.00% | 0.00% | 0.00% | 0.00% | 0.00% | -1,051.23% | -357.29% | -44.63% | -143.95% |
| EPS | -0.04 | -0.02 | -0.04 | -0.03 | -0.01 | -0.08 | -0.05 | -0.42 | -0.74 | -0.16 | -0.47 |
| EPS Diluted | -0.04 | -0.02 | -0.04 | -0.03 | -0.01 | -0.08 | -0.05 | -0.42 | -0.74 | -0.16 | -0.47 |
| Weighted Avg Shares Out | 246.65M | 177.99M | 123.30M | 47.12M | 33.67M | 30.21M | 15.54M | 15.01M | 14.76M | 11.00M | 8.65M |
| Weighted Avg Shares Out (Dil) | 246.65M | 177.99M | 123.30M | 47.12M | 33.67M | 30.21M | 15.54M | 15.01M | 14.76M | 11.00M | 8.65M |

Royal Helium closes C$5.5M bought deal debt offering to fund Steveville production facilities

Royal Helium says it is now fully funded through to production at Steveville helium field after closing financing package

Royal Helium inks US$20M credit facility for project financing
Royal Helium closes exercise of over-allotment option to fund construction of Alberta helium production plant
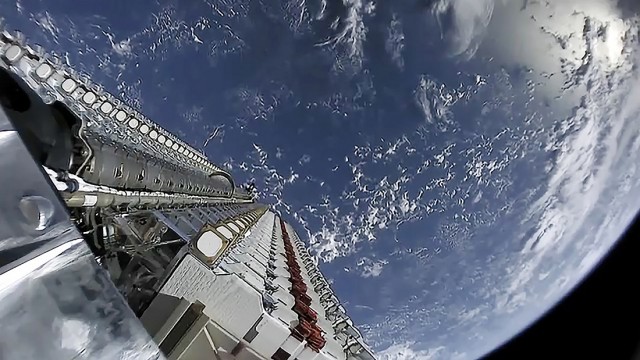
Royal Helium destined for the stars? Space launch company will be first customer for AIM newbie

Royal Helium completes $7.2M financing to fund Alberta helium production plant construction

Royal Helium awards Steveville processing plant construction contract to Alberta's Arjae Design Solutions
Royal Helium is rapidly advancing from exploration to production of green helium in Western Canada
Royal Helium announces $7M bought deal financing
Royal Helium announces $5M bought deal financing
Source: https://incomestatements.info
Category: Stock Reports
