See more : Qibu Co.,Ltd. (603557.SS) Income Statement Analysis – Financial Results
Complete financial analysis of Royal Helium Ltd. (RHCCF) income statement, including revenue, profit margins, EPS and key performance metrics. Get detailed insights into the financial performance of Royal Helium Ltd., a leading company in the Oil & Gas Exploration & Production industry within the Energy sector.
- Greenville Federal Financial Corporation (GVFF) Income Statement Analysis – Financial Results
- Tambourah Metals Limited (TMB.AX) Income Statement Analysis – Financial Results
- PPAP Automotive Limited (PPAP.NS) Income Statement Analysis – Financial Results
- Fujicopian Co., Ltd. (7957.T) Income Statement Analysis – Financial Results
- Hard Off Corporation Co.,Ltd. (2674.T) Income Statement Analysis – Financial Results
Royal Helium Ltd. (RHCCF)
About Royal Helium Ltd.
Royal Helium Ltd. engages in the exploration and development of helium properties in Canada. It holds approximately 348,908 hectares of prospective helium lands in southern Saskatchewan. The company is headquartered in Saskatoon, Canada.
| Metric | 2023 | 2022 | 2021 | 2020 | 2019 | 2018 | 2017 | 2016 | 2015 | 2014 | 2013 |
|---|---|---|---|---|---|---|---|---|---|---|---|
| Revenue | 98.16K | 0.00 | 0.00 | 0.00 | 0.00 | 0.00 | 0.00 | 605.69K | 3.05M | 3.90M | 2.82M |
| Cost of Revenue | 946.97K | 0.00 | 0.00 | 0.00 | 0.00 | 0.00 | 0.00 | 298.18K | 1.66M | 1.72M | 1.25M |
| Gross Profit | -848.81K | 0.00 | 0.00 | 0.00 | 0.00 | 0.00 | 0.00 | 307.51K | 1.39M | 2.18M | 1.58M |
| Gross Profit Ratio | -864.70% | 0.00% | 0.00% | 0.00% | 0.00% | 0.00% | 0.00% | 50.77% | 45.52% | 55.84% | 55.86% |
| Research & Development | 0.00 | 0.00 | 0.00 | 0.00 | 0.00 | 0.00 | 0.00 | 0.00 | 0.00 | 0.00 | 0.00 |
| General & Administrative | 3.97M | 4.20M | 5.16M | 1.33M | 351.66K | 707.82K | 937.47K | 2.12M | 2.64M | 2.04M | 723.12K |
| Selling & Marketing | 820.04K | 975.98K | 1.03M | 325.02K | 17.77K | 0.00 | 5.81 | 0.00 | 0.00 | 0.00 | 0.00 |
| SG&A | 4.79M | 4.20M | 5.16M | 1.33M | 351.66K | 707.82K | 937.47K | 2.12M | 2.64M | 2.04M | 723.12K |
| Other Expenses | -5.64M | 0.00 | 4.18K | 3.05K | 112.15K | 10.11K | 0.00 | 1.13M | 0.00 | 0.00 | 0.00 |
| Operating Expenses | -848.81K | 4.20M | 5.16M | 1.33M | 351.66K | 707.82K | 937.47K | 2.12M | 4.88M | 3.84M | 2.47M |
| Cost & Expenses | 8.60M | 4.20M | 5.16M | 1.33M | 351.66K | 707.82K | 937.47K | 2.42M | 6.55M | 5.56M | 3.71M |
| Interest Income | 51.61K | 0.00 | 32.19K | 0.00 | 0.00 | 0.00 | 0.00 | 13.42K | 38.21K | 26.95K | 18.29K |
| Interest Expense | 2.59M | 0.00 | 0.00 | 0.00 | 0.00 | 0.00 | 0.00 | 0.00 | 0.00 | 0.00 | 0.00 |
| Depreciation & Amortization | 941.33K | 9.55K | 4.13M | 1.01M | 333.90K | 707.82K | 995.88K | 4.57M | 2.23M | 1.58M | 1.71M |
| EBITDA | -7.52M | -4.19M | -991.65K | -321.97K | 94.38K | 10.11K | 224.32K | 2.75M | 6.19M | -86.20K | 819.98K |
| EBITDA Ratio | -7,655.98% | 0.00% | 0.00% | 0.00% | 0.00% | 0.00% | 0.00% | 454.25% | 202.76% | -2.21% | 144.98% |
| Operating Income | -8.06M | -4.01M | -5.16M | -1.33M | -351.66K | -707.82K | -937.47K | -1.81M | -17.39M | -1.66M | -4.18M |
| Operating Income Ratio | -8,207.15% | 0.00% | 0.00% | 0.00% | 0.00% | 0.00% | 0.00% | -299.60% | -569.37% | -42.63% | -148.09% |
| Total Other Income/Expenses | -2.99M | -190.00K | -991.65K | 3.05K | 94.38K | 10.11K | 211.16K | -4.55M | 6.48M | 3.31M | 36.01K |
| Income Before Tax | -11.04M | -4.39M | -5.13M | -1.33M | -239.51K | -697.71K | -726.31K | -6.37M | -10.91M | -1.63M | -4.15M |
| Income Before Tax Ratio | -11,250.41% | 0.00% | 0.00% | 0.00% | 0.00% | 0.00% | 0.00% | -1,051.23% | -357.29% | -41.88% | -146.81% |
| Income Tax Expense | 0.00 | 189.99K | -36.33K | -1.01K | -333.90 | 1.70M | 0.00 | -13.42K | 7.42M | 107.06K | -80.75K |
| Net Income | -11.04M | -4.39M | -5.13M | -1.33M | -239.51K | -2.40M | -726.31K | -6.37M | -10.91M | -1.74M | -4.07M |
| Net Income Ratio | -11,250.41% | 0.00% | 0.00% | 0.00% | 0.00% | 0.00% | 0.00% | -1,051.23% | -357.29% | -44.63% | -143.95% |
| EPS | -0.04 | -0.02 | -0.04 | -0.03 | -0.01 | -0.08 | -0.05 | -0.42 | -0.74 | -0.16 | -0.47 |
| EPS Diluted | -0.04 | -0.02 | -0.04 | -0.03 | -0.01 | -0.08 | -0.05 | -0.42 | -0.74 | -0.16 | -0.47 |
| Weighted Avg Shares Out | 246.65M | 177.99M | 123.30M | 47.12M | 33.67M | 30.21M | 15.54M | 15.01M | 14.76M | 11.00M | 8.65M |
| Weighted Avg Shares Out (Dil) | 246.65M | 177.99M | 123.30M | 47.12M | 33.67M | 30.21M | 15.54M | 15.01M | 14.76M | 11.00M | 8.65M |

Royal Helium Announces Upsizing of Previously Announced LIFE Offering of Units to $5,175,000
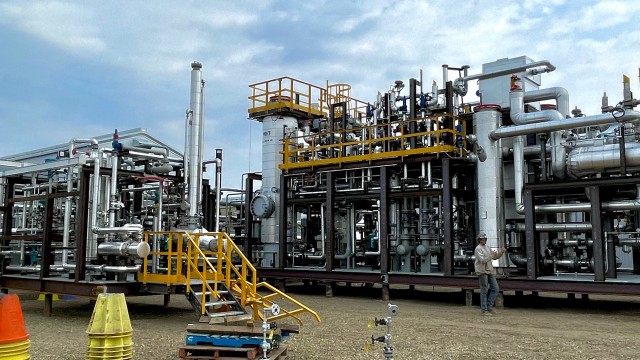
Royal Helium on cloud nine it becomes first publicly-traded independent helium producer

Royal Helium announces overnight marketed LIFE offering of units for $3M

Royal Helium Announces Overnight Marketed LIFE Offering of Units for $3 Million
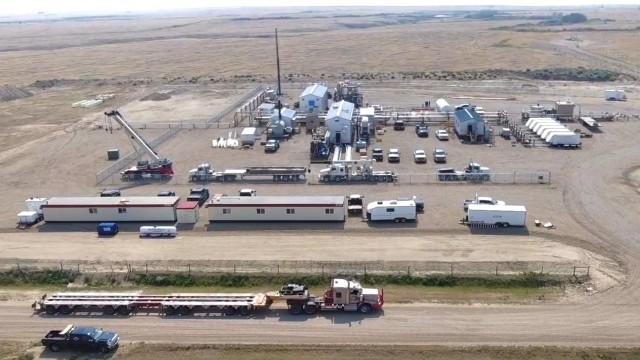
Royal Helium marks start of commercial sales at Steveville with first trailer loading underway
Royal Helium maintains its ‘Speculative Buy' rating from Research Capital on positive Steveville news
Royal Helium completes facility commissioning and announces start-up of Steveville helium plant

Royal Helium nearing production at Steveville helium plant
Royal Helium subsidiary to buy new project in Alberta
Royal Helium begins moving helium processing plant to Steveville site
Source: https://incomestatements.info
Category: Stock Reports
