See more : Lypsa Gems & Jewellery Limited (LYPSAGEMS.BO) Income Statement Analysis – Financial Results
Complete financial analysis of The Boston Beer Company, Inc. (SAM) income statement, including revenue, profit margins, EPS and key performance metrics. Get detailed insights into the financial performance of The Boston Beer Company, Inc., a leading company in the Beverages – Alcoholic industry within the Consumer Defensive sector.
- Oaktree Strategic Income Corporation (OCSI) Income Statement Analysis – Financial Results
- Check Point Software Technologies Ltd. (CHKP) Income Statement Analysis – Financial Results
- NIVAKA FASHIONS LIMITED (NIVAKA.BO) Income Statement Analysis – Financial Results
- BYTE Acquisition Corp. (BYTSW) Income Statement Analysis – Financial Results
- Goldquest Mining Corp. (GQC.V) Income Statement Analysis – Financial Results
The Boston Beer Company, Inc. (SAM)
About The Boston Beer Company, Inc.
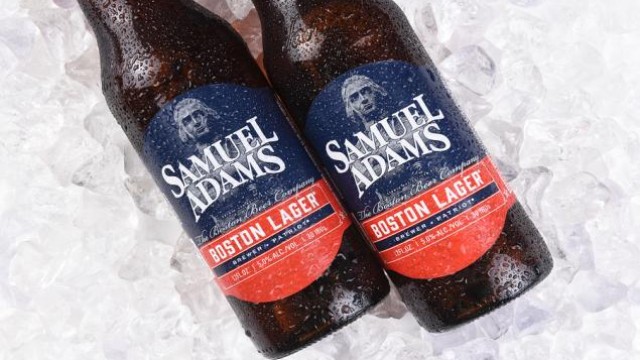
The Boston Beer Company, Inc. produces and sells alcohol beverages primarily in the United States. The company's flagship beer is Samuel Adams Boston Lager. It offers various beers, hard ciders, and hard seltzers under the Samuel Adams, Twisted Tea, Truly Hard Seltzer, Angry Orchard, Dogfish Head, Angel City, Coney Island, Concrete Beach brand names. The company markets and sells its products to a network of approximately 400 wholesalers in the United States, as well as international wholesalers, importers, or other agencies that in turn sell to retailers, such as grocery stores, club stores, convenience stores, liquor stores, bars, restaurants, stadiums, and other retail outlets. It also sells in products in Canada, Europe, Israel, Australia, New Zealand, the Caribbean, the Pacific Rim, Mexico, and Central and South America. The Boston Beer Company, Inc. was founded in 1984 and is based in Boston, Massachusetts.
| Metric | 2023 | 2022 | 2021 | 2020 | 2019 | 2018 | 2017 | 2016 | 2015 | 2014 | 2013 | 2012 | 2011 | 2010 | 2009 | 2008 | 2007 | 2006 | 2005 | 2004 | 2003 | 2002 | 2001 | 2000 | 1999 | 1998 | 1997 | 1996 | 1995 |
|---|---|---|---|---|---|---|---|---|---|---|---|---|---|---|---|---|---|---|---|---|---|---|---|---|---|---|---|---|---|
| Revenue | 2.01B | 2.09B | 2.06B | 1.74B | 1.25B | 995.65M | 862.99M | 906.45M | 959.93M | 903.01M | 739.05M | 580.22M | 513.00M | 463.80M | 415.05M | 398.40M | 341.65M | 285.43M | 238.30M | 217.21M | 207.95M | 215.36M | 186.78M | 190.55M | 176.80M | 183.50M | 183.80M | 191.10M | 151.30M |
| Cost of Revenue | 1.16B | 1.23B | 1.26B | 921.98M | 635.66M | 483.41M | 413.09M | 446.78M | 458.32M | 438.00M | 354.13M | 265.01M | 228.43M | 207.47M | 201.24M | 214.51M | 152.29M | 121.16M | 96.83M | 87.97M | 85.61M | 88.37M | 81.69M | 77.62M | 72.50M | 84.20M | 85.50M | 92.80M | 72.20M |
| Gross Profit | 852.37M | 861.99M | 797.79M | 814.45M | 614.17M | 512.24M | 449.90M | 459.67M | 501.62M | 465.01M | 384.92M | 315.21M | 284.57M | 256.33M | 213.82M | 183.89M | 189.36M | 164.28M | 141.47M | 129.24M | 122.34M | 126.99M | 105.09M | 112.94M | 104.30M | 99.30M | 98.30M | 98.30M | 79.10M |
| Gross Profit Ratio | 42.44% | 41.24% | 38.77% | 46.90% | 49.14% | 51.45% | 52.13% | 50.71% | 52.26% | 51.50% | 52.08% | 54.33% | 55.47% | 55.27% | 51.52% | 46.16% | 55.43% | 57.55% | 59.37% | 59.50% | 58.83% | 58.97% | 56.26% | 59.27% | 58.99% | 54.11% | 53.48% | 51.44% | 52.28% |
| Research & Development | 0.00 | 0.00 | 0.00 | 0.00 | 0.00 | 0.00 | 0.00 | 0.00 | 0.00 | 0.00 | 0.00 | 0.00 | 0.00 | 0.00 | 0.00 | 0.00 | 0.00 | 0.00 | 0.00 | 0.00 | 0.00 | 0.00 | 0.00 | 0.00 | 0.00 | 0.00 | 0.00 | 0.00 | 0.00 |
| General & Administrative | 174.55M | 157.53M | 133.62M | 118.21M | 112.73M | 90.86M | 73.13M | 78.03M | 71.56M | 65.97M | 62.33M | 50.17M | 43.49M | 39.11M | 36.94M | 34.99M | 24.57M | 22.66M | 17.29M | 14.84M | 14.63M | 14.59M | 13.53M | 12.54M | 11.57M | 0.00 | 0.00 | 0.00 | 0.00 |
| Selling & Marketing | 556.00M | 578.40M | 606.99M | 447.57M | 355.61M | 304.85M | 258.65M | 244.21M | 273.63M | 250.70M | 207.93M | 169.31M | 157.26M | 135.74M | 121.56M | 132.90M | 124.46M | 113.67M | 100.87M | 94.91M | 91.84M | 100.73M | 80.12M | 77.84M | 69.94M | 0.00 | 0.00 | 0.00 | 0.00 |
| SG&A | 730.55M | 735.93M | 740.62M | 565.78M | 468.34M | 395.71M | 331.78M | 322.25M | 345.19M | 316.67M | 270.26M | 219.48M | 200.75M | 174.85M | 158.50M | 167.89M | 149.03M | 136.33M | 118.16M | 109.75M | 106.47M | 115.32M | 93.65M | 90.38M | 81.50M | 79.50M | 81.20M | 82.10M | 68.00M |
| Other Expenses | 21.82M | -1.92M | -978.00K | 222.00K | -1.19M | -887.00K | -82.00K | -706.00K | -1.22M | -994.00K | -583.00K | -98.00K | 0.00 | 300.00K | 0.00 | 1.94M | 3.44M | 0.00 | 0.00 | 0.00 | -100.00K | 0.00 | 0.00 | 6.44M | 5.90M | 5.20M | 4.50M | 3.00M | 1.60M |
| Operating Expenses | 752.37M | 735.93M | 740.62M | 565.78M | 468.34M | 395.71M | 331.78M | 322.25M | 345.19M | 316.67M | 270.26M | 219.48M | 200.75M | 174.85M | 158.50M | 169.83M | 152.47M | 136.33M | 118.16M | 109.75M | 106.37M | 115.32M | 93.65M | 96.82M | 87.40M | 84.70M | 85.70M | 85.10M | 69.60M |
| Cost & Expenses | 1.91B | 1.96B | 2.00B | 1.49B | 1.10B | 879.12M | 744.87M | 769.02M | 803.50M | 754.66M | 624.39M | 484.49M | 429.18M | 382.32M | 359.73M | 384.34M | 304.76M | 257.48M | 214.99M | 197.72M | 191.98M | 203.69M | 175.35M | 174.43M | 159.90M | 168.90M | 171.20M | 177.90M | 141.80M |
| Interest Income | 0.00 | 2.56M | 110.00K | 199.00K | 647.00K | 1.29M | 549.00K | 168.00K | 56.00K | 21.00K | 31.00K | 31.00K | 54.00K | 79.00K | 112.00K | 1.60M | 4.25M | 0.00 | 0.00 | 0.00 | 0.00 | 0.00 | 0.00 | 0.00 | 0.00 | 0.00 | 0.00 | 0.00 | 0.00 |
| Interest Expense | 0.00 | 2.56M | 110.00K | 199.00K | 0.00 | 1.29M | 549.00K | 168.00K | 56.00K | 21.00K | 31.00K | 31.00K | 54.00K | 79.00K | 112.00K | 0.00 | 0.00 | 0.00 | 0.00 | 0.00 | 0.00 | 0.00 | 0.00 | 0.00 | 0.00 | 0.00 | 0.00 | 0.00 | 0.00 |
| Depreciation & Amortization | 88.14M | 89.33M | 80.11M | 73.01M | 56.27M | 51.97M | 51.26M | 49.56M | 42.89M | 35.14M | 25.90M | 20.21M | 18.79M | 17.43M | 16.92M | 12.50M | 6.65M | 4.99M | 4.52M | 5.03M | 7.11M | 6.15M | 6.66M | 6.44M | 5.90M | 5.20M | 4.50M | 3.00M | 1.60M |
| EBITDA | 209.96M | 242.67M | 87.13M | 317.44M | 202.09M | 168.50M | 169.38M | 186.98M | 199.32M | 183.48M | 140.56M | 115.94M | 122.29M | 98.54M | 71.29M | 28.34M | 48.30M | 32.94M | 27.84M | 24.51M | 23.08M | 11.67M | 11.44M | 22.56M | 22.80M | 19.80M | 17.10M | 16.20M | 11.10M |
| EBITDA Ratio | 10.45% | 11.61% | 8.67% | 18.36% | 16.24% | 16.99% | 19.91% | 20.60% | 20.79% | 20.52% | 19.23% | 20.01% | 16.18% | 21.42% | 17.66% | 7.11% | 13.60% | 11.31% | 11.50% | 11.40% | 11.09% | 7.67% | 9.52% | 10.79% | 12.84% | 10.57% | 8.49% | 7.48% | 6.54% |
| Operating Income | 100.00M | 161.31M | 106.35M | 244.21M | 144.91M | 115.88M | 115.68M | 137.66M | 156.17M | 146.57M | 113.09M | 95.58M | 103.66M | 81.18M | 54.27M | 14.06M | 36.89M | 27.95M | 23.32M | 19.49M | 15.87M | 11.67M | 11.44M | 16.12M | 16.90M | 14.60M | 12.60M | 13.20M | 9.50M |
| Operating Income Ratio | 4.98% | 7.72% | 5.17% | 14.06% | 11.59% | 11.64% | 13.40% | 15.19% | 16.27% | 16.23% | 15.30% | 16.47% | 20.21% | 17.50% | 13.08% | 3.53% | 10.80% | 9.79% | 9.78% | 8.97% | 7.63% | 5.42% | 6.12% | 8.46% | 9.56% | 7.96% | 6.86% | 6.91% | 6.28% |
| Total Other Income/Expenses | 9.59M | -34.62M | -1.09M | 23.00K | -542.00K | 405.00K | 467.00K | -538.00K | -1.16M | -973.00K | -552.00K | -216.00K | -155.00K | -70.00K | 96.00K | 1.78M | 1.32M | 3.82M | 2.20M | 593.00K | 1.10M | 2.42M | 1.78M | 2.93M | 2.20M | -300.00K | 700.00K | 1.70M | 900.00K |
| Income Before Tax | 109.59M | 91.44M | 6.91M | 244.23M | 144.37M | 116.29M | 116.14M | 137.12M | 155.01M | 145.59M | 112.54M | 95.52M | 103.50M | 81.11M | 54.37M | 15.84M | 41.64M | 31.77M | 25.52M | 20.08M | 16.97M | 14.09M | 13.22M | 19.05M | 19.10M | 14.30M | 13.30M | 14.90M | 10.40M |
| Income Before Tax Ratio | 5.46% | 4.37% | 0.34% | 14.07% | 11.55% | 11.68% | 13.46% | 15.13% | 16.15% | 16.12% | 15.23% | 16.46% | 20.18% | 17.49% | 13.10% | 3.98% | 12.19% | 11.13% | 10.71% | 9.24% | 8.16% | 6.54% | 7.08% | 10.00% | 10.80% | 7.79% | 7.24% | 7.80% | 6.87% |
| Income Tax Expense | 33.34M | 24.17M | -7.64M | 52.27M | 34.33M | 23.62M | 17.09M | 49.77M | 56.60M | 54.85M | 42.15M | 36.05M | 37.44M | 30.97M | 23.25M | 7.75M | 19.15M | 13.57M | 9.96M | 7.58M | 6.42M | 5.54M | 5.38M | 7.81M | 8.00M | 6.40M | 5.70M | 6.50M | -2.20M |
| Net Income | 76.25M | 67.26M | 14.55M | 191.96M | 110.04M | 92.66M | 99.05M | 87.35M | 98.41M | 90.74M | 70.39M | 59.47M | 66.06M | 50.14M | 31.12M | 8.09M | 22.49M | 18.19M | 15.56M | 12.50M | 10.56M | 8.55M | 7.83M | 11.24M | 11.10M | 7.90M | 7.60M | 8.40M | 12.60M |
| Net Income Ratio | 3.80% | 3.22% | 0.71% | 11.05% | 8.80% | 9.31% | 11.48% | 9.64% | 10.25% | 10.05% | 9.52% | 10.25% | 12.88% | 10.81% | 7.50% | 2.03% | 6.58% | 6.37% | 6.53% | 5.76% | 5.08% | 3.97% | 4.19% | 5.90% | 6.28% | 4.31% | 4.13% | 4.40% | 8.33% |
| EPS | 6.23 | 5.46 | 1.19 | 15.83 | 9.26 | 7.97 | 8.18 | 6.93 | 7.46 | 6.96 | 5.47 | 4.60 | 5.08 | 3.67 | 2.21 | 0.58 | 1.58 | 1.31 | 1.10 | 0.89 | 0.72 | 0.53 | 0.48 | 0.62 | 0.54 | 0.39 | 0.37 | 0.42 | 0.33 |
| EPS Diluted | 6.22 | 5.44 | 1.17 | 15.53 | 9.16 | 7.90 | 8.09 | 6.79 | 7.25 | 6.69 | 5.18 | 4.39 | 4.81 | 3.52 | 2.17 | 0.56 | 1.53 | 1.27 | 1.07 | 0.86 | 0.70 | 0.52 | 0.47 | 0.62 | 0.54 | 0.39 | 0.37 | 0.41 | 0.33 |
| Weighted Avg Shares Out | 12.24M | 12.32M | 12.28M | 12.13M | 11.89M | 11.62M | 12.04M | 12.53M | 13.12M | 12.97M | 12.77M | 12.91M | 13.01M | 13.66M | 14.06M | 13.93M | 14.19M | 13.90M | 14.13M | 14.13M | 14.72M | 16.08M | 16.41M | 18.06M | 20.56M | 20.26M | 20.54M | 20.00M | 19.75M |
| Weighted Avg Shares Out (Dil) | 12.26M | 12.35M | 12.44M | 12.28M | 11.91M | 11.73M | 12.18M | 12.80M | 13.52M | 13.48M | 13.50M | 13.44M | 13.74M | 14.23M | 14.36M | 14.34M | 14.70M | 14.38M | 14.52M | 14.52M | 15.00M | 16.41M | 16.59M | 18.11M | 20.56M | 20.26M | 20.54M | 20.49M | 19.75M |

Dogfish Head Cocktails Expands Award-Winning Lineup of Spirits-Based, Ready-to-Drink Cocktails with New Strawberry Lime Tequila Margarita

Boston Beer (SAM) Stock Rallies on Q1 Earnings & Revenue Beat

Dogfish Head Craft Brewery Unveils New Beer Packaging Artwork & Announces the Return of its Fan-Favorite 120 Minute IPA

SAMUEL ADAMS TAPPED AS THE OFFICIAL BEER AND NON-ALCOHOLIC BEER OF THE PAN-MASS CHALLENGE

Boston Beer (SAM) Surpasses Q1 Earnings and Revenue Estimates

Boston Beer's stock surges after a surprise profit, as increases in Twisted Tea shipments offset declines in Truly

Boston Beer Reports First Quarter Financial Results

Are These 4 Beverage Stocks Poised to Hit Q1 Earnings Targets?

The Boston Beer Company Debuts First-of-its-Kind Non-Alc Beverage, General Admission, Available Now via Direct-to-Consumer Shipping

Can Boston Beer (SAM) Beat on Q1 Earnings Despite Cost Woes?
Source: https://incomestatements.info
Category: Stock Reports
