See more : S.P. Apparels Limited (SPAL.BO) Income Statement Analysis – Financial Results
Complete financial analysis of Zurn Elkay Water Solutions Corporation (ZWS) income statement, including revenue, profit margins, EPS and key performance metrics. Get detailed insights into the financial performance of Zurn Elkay Water Solutions Corporation, a leading company in the Industrial – Pollution & Treatment Controls industry within the Industrials sector.
- Mianyang Fulin Precision Co.,Ltd. (300432.SZ) Income Statement Analysis – Financial Results
- Mediobanca Banca di Credito Finanziario S.p.A. (MB.MI) Income Statement Analysis – Financial Results
- Shenzhen Hemei Group Co.,LTD. (002356.SZ) Income Statement Analysis – Financial Results
- Banco Santander (Brasil) S.A. (SANB11.SA) Income Statement Analysis – Financial Results
- Jounce Therapeutics, Inc. (JNCE) Income Statement Analysis – Financial Results
Zurn Elkay Water Solutions Corporation (ZWS)
Industry: Industrial - Pollution & Treatment Controls
Sector: Industrials
Website: https://zurnwatersolutions.com
About Zurn Elkay Water Solutions Corporation
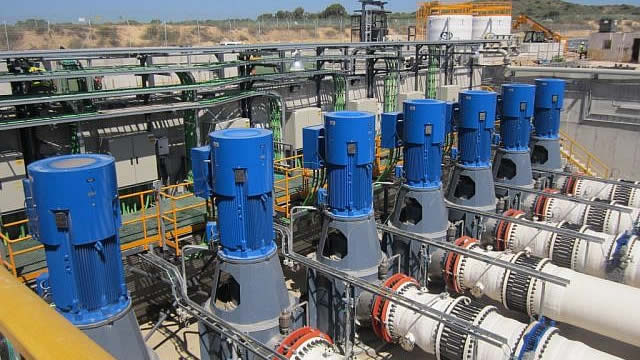
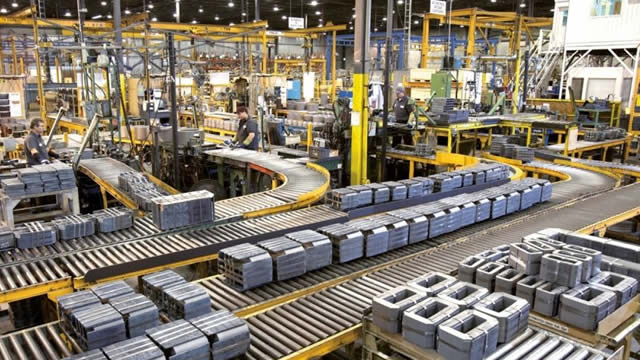
Zurn Elkay Water Solutions Corporation designs, procures, manufactures, and markets water system solutions that provide and enhance water quality, safety, flow control, and conservation in and around non-residential buildings. It offers finish plumbing, drainage and interceptors, water control and backflow, fire protection, PEX pipe fittings and accessories, and repair parts under the Zurn brand name; and hand and hair dryers, and baby changing stations under the World Dryer brand name. The company also offers stainless steel products under the Just Manufacturing brand name, which include stainless steel sinks for classrooms and academic institutions; ADA commercial stainless-steel sinks and plumbing fixtures for assisted living; faucets, bubblers, drains, and accessories; and stainless steel fixtures and related products for food services, government, healthcare, hospitality, institutional, and residential markets. It serves higher education, healthcare, retail, restaurant, hospitality, education, government, and fire protection markets. The company was formerly known as Zurn Water Solutions Corporation. Zurn Elkay Water Solutions Corporation was incorporated in 2006 and is headquartered in Milwaukee, Wisconsin.
| Metric | 2023 | 2022 | 2021 | 2020 | 2019 | 2018 | 2017 | 2016 | 2015 | 2014 | 2013 | 2012 | 2011 | 2010 | 2009 | 1999 | 1998 | 1997 | 1996 | 1995 | 1994 | 1993 | 1992 | 1991 | 1990 | 1989 | 1988 | 1987 | 1986 | 1985 |
|---|---|---|---|---|---|---|---|---|---|---|---|---|---|---|---|---|---|---|---|---|---|---|---|---|---|---|---|---|---|---|
| Revenue | 1.53B | 1.28B | 910.90M | 562.70M | 2.05B | 2.05B | 2.07B | 1.92B | 1.92B | 2.05B | 2.08B | 2.01B | 1.97B | 1.70B | 1.51B | 15.90M | 13.70M | 2.30M | 300.00K | 200.00K | 84.20M | 83.90M | 86.40M | 91.20M | 118.20M | 117.80M | 115.80M | 119.70M | 102.10M | 100.40M |
| Cost of Revenue | 941.10M | 816.30M | 537.70M | 309.40M | 1.27B | 1.27B | 1.31B | 1.25B | 1.26B | 1.30B | 1.32B | 1.27B | 1.28B | 1.10B | 994.40M | 12.39M | 10.00M | 1.10M | 0.00 | 300.00K | 66.60M | 65.40M | 67.00M | 66.90M | 92.30M | 89.40M | 86.30M | 114.60M | 73.80M | 78.90M |
| Gross Profit | 589.40M | 465.50M | 373.20M | 253.30M | 784.80M | 784.80M | 756.90M | 668.00M | 665.20M | 746.20M | 763.60M | 731.40M | 693.50M | 596.80M | 515.60M | 3.51M | 3.70M | 1.20M | 300.00K | -100.00K | 17.60M | 18.50M | 19.40M | 24.30M | 25.90M | 28.40M | 29.50M | 5.10M | 28.30M | 21.50M |
| Gross Profit Ratio | 38.51% | 36.32% | 40.97% | 45.02% | 38.27% | 38.27% | 36.64% | 34.82% | 34.58% | 36.40% | 36.68% | 36.48% | 35.21% | 35.11% | 34.15% | 22.06% | 27.01% | 52.17% | 100.00% | -50.00% | 20.90% | 22.05% | 22.45% | 26.64% | 21.91% | 24.11% | 25.47% | 4.26% | 27.72% | 21.41% |
| Research & Development | 23.70M | 0.00 | 0.00 | 0.00 | 0.00 | 41.70M | 0.00 | 0.00 | 0.00 | 0.00 | 0.00 | 0.00 | 0.00 | 0.00 | 0.00 | 0.00 | 0.00 | 0.00 | 0.00 | 0.00 | 0.00 | 0.00 | 0.00 | 0.00 | 0.00 | 0.00 | 0.00 | 0.00 | 0.00 | 0.00 |
| General & Administrative | 329.20M | 0.00 | 0.00 | 0.00 | 0.00 | 421.20M | 446.20M | 410.60M | 398.60M | 474.50M | 0.00 | 0.00 | 0.00 | 0.00 | 0.00 | 0.00 | 0.00 | 0.00 | 0.00 | 0.00 | 0.00 | 0.00 | 0.00 | 0.00 | 0.00 | 0.00 | 0.00 | 0.00 | 0.00 | 0.00 |
| Selling & Marketing | 18.40M | 0.00 | 0.00 | 0.00 | 0.00 | 11.90M | 3.30M | 2.60M | -12.90M | -59.40M | 0.00 | 0.00 | 0.00 | 0.00 | 0.00 | 0.00 | 0.00 | 0.00 | 0.00 | 0.00 | 0.00 | 0.00 | 0.00 | 0.00 | 0.00 | 0.00 | 0.00 | 0.00 | 0.00 | 0.00 |
| SG&A | 347.60M | 309.00M | 239.00M | 153.70M | 433.10M | 433.10M | 449.50M | 413.20M | 385.70M | 415.10M | 424.50M | 406.20M | 389.40M | 329.10M | 297.70M | 3.43M | 3.90M | 1.20M | 500.00K | 200.00K | 14.90M | 16.20M | 19.40M | 21.70M | 28.90M | 25.40M | 23.50M | 0.00 | 20.40M | 18.60M |
| Other Expenses | -5.20M | 34.00M | 23.50M | 16.90M | -1.20M | -1.20M | -3.10M | -5.20M | 3.10M | -7.20M | -15.10M | -2.90M | -7.10M | 48.60M | -16.40M | 485.00K | 400.00K | 200.00K | 0.00 | 300.00K | 500.00K | 600.00K | 600.00K | 600.00K | 600.00K | 600.00K | 600.00K | 600.00K | 500.00K | 600.00K |
| Operating Expenses | 371.30M | 343.00M | 262.50M | 170.60M | 467.10M | 467.10M | 483.10M | 455.30M | 443.10M | 470.20M | 475.30M | 457.30M | 440.30M | 377.70M | 347.40M | 3.92M | 4.30M | 1.40M | 500.00K | 500.00K | 15.40M | 16.80M | 20.00M | 22.30M | 29.50M | 26.00M | 24.10M | 600.00K | 20.90M | 19.20M |
| Cost & Expenses | 1.31B | 1.16B | 800.20M | 480.00M | 1.73B | 1.73B | 1.79B | 1.71B | 1.70B | 1.77B | 1.79B | 1.73B | 1.72B | 1.48B | 1.34B | 16.31M | 14.30M | 2.50M | 500.00K | 800.00K | 82.00M | 82.20M | 87.00M | 89.20M | 121.80M | 115.40M | 110.40M | 115.20M | 94.70M | 98.10M |
| Interest Income | 0.00 | 0.00 | 0.00 | 0.00 | 0.00 | 69.90M | 0.00 | 0.00 | 0.00 | 0.00 | 0.00 | 0.00 | 0.00 | 0.00 | 0.00 | 0.00 | 0.00 | 0.00 | 0.00 | 0.00 | 0.00 | 0.00 | 0.00 | 0.00 | 0.00 | 0.00 | 0.00 | 0.00 | 0.00 | 0.00 |
| Interest Expense | 38.50M | 26.90M | 34.70M | 33.30M | 69.90M | 69.90M | 75.60M | 88.70M | 91.40M | 87.90M | 109.10M | 153.30M | 176.20M | 380.20M | 194.20M | 1.35M | 0.00 | 0.00 | 0.00 | 0.00 | 0.00 | 0.00 | 0.00 | 2.40M | 3.60M | 3.40M | 900.00K | 800.00K | 300.00K | 1.10M |
| Depreciation & Amortization | 87.90M | 73.50M | 81.70M | 66.50M | 92.30M | 92.30M | 89.70M | 105.40M | 115.40M | 112.20M | 108.50M | 112.40M | 114.40M | 106.10M | 109.30M | -485.00K | -400.00K | -200.00K | 0.00 | -300.00K | -500.00K | -600.00K | -600.00K | -600.00K | -600.00K | -600.00K | 600.00K | 600.00K | 500.00K | 600.00K |
| EBITDA | 306.00M | 180.60M | 188.70M | 147.50M | 408.80M | 408.80M | 360.40M | 312.90M | 340.60M | 381.00M | 381.70M | 383.60M | 360.50M | 424.90M | 261.10M | 135.00K | -200.00K | -100.00K | -200.00K | -300.00K | 2.70M | 2.30M | -2.40M | 2.60M | -3.00M | 3.00M | 6.00M | 5.10M | 7.90M | 2.90M |
| EBITDA Ratio | 19.99% | 14.09% | 20.72% | 26.21% | 19.93% | 19.93% | 17.44% | 16.31% | 17.70% | 18.58% | 18.33% | 19.13% | 18.30% | 25.00% | 17.29% | 0.85% | -1.46% | -4.35% | -66.67% | -150.00% | 3.21% | 2.74% | -2.78% | 2.85% | -2.54% | 2.55% | 5.18% | 4.26% | 7.74% | 2.89% |
| Operating Income | 218.10M | 107.10M | 107.00M | 81.00M | 305.60M | 305.60M | 147.10M | 183.70M | 174.30M | 203.70M | 279.60M | 255.40M | 241.80M | 219.10M | 161.40M | 620.00K | 200.00K | 100.00K | -200.00K | 0.00 | 3.20M | 2.90M | -1.80M | 3.20M | -2.40M | 3.60M | 5.40M | 4.50M | 7.40M | 2.30M |
| Operating Income Ratio | 14.25% | 8.36% | 11.75% | 14.39% | 14.90% | 14.90% | 7.12% | 9.58% | 9.06% | 9.94% | 13.43% | 12.74% | 12.28% | 12.89% | 10.69% | 3.90% | 1.46% | 4.35% | -66.67% | 0.00% | 3.80% | 3.46% | -2.08% | 3.51% | -2.03% | 3.06% | 4.66% | 3.76% | 7.25% | 2.29% |
| Total Other Income/Expenses | -71.30M | -23.30M | -54.60M | -35.50M | -9.00M | -9.00M | -141.70M | -42.00M | -44.70M | -79.50M | -157.00M | -45.60M | -35.60M | -99.70M | 144.60M | -62.00K | 0.00 | 100.00K | 0.00 | 0.00 | 0.00 | 0.00 | 0.00 | -2.40M | -3.60M | -3.40M | -900.00K | -800.00K | -300.00K | -1.10M |
| Income Before Tax | 146.80M | 83.80M | 52.40M | 45.50M | 238.80M | 238.80M | 56.50M | 82.00M | 86.00M | 108.60M | 22.20M | 75.20M | 41.40M | -61.40M | 118.60M | -727.00K | 0.00 | 200.00K | 0.00 | 0.00 | 0.00 | 0.00 | -1.80M | 800.00K | -6.00M | 200.00K | 4.50M | 3.70M | 7.10M | 1.20M |
| Income Before Tax Ratio | 9.59% | 6.54% | 5.75% | 8.09% | 11.64% | 11.64% | 2.73% | 4.27% | 4.47% | 5.30% | 1.07% | 3.75% | 2.10% | -3.61% | 7.85% | -4.57% | 0.00% | 8.70% | 0.00% | 0.00% | 0.00% | 0.00% | -2.08% | 0.88% | -5.08% | 0.17% | 3.89% | 3.09% | 6.95% | 1.20% |
| Income Tax Expense | 42.60M | 26.80M | 2.70M | 10.50M | 53.40M | 53.40M | -19.50M | 7.90M | 17.10M | 16.80M | -7.40M | 20.30M | 11.50M | -10.10M | 30.50M | 9.00K | 700.00K | 300.00K | 1.10M | 6.90M | 3.00M | 2.70M | -500.00K | 300.00K | -2.40M | 100.00K | 1.80M | 1.60M | 3.40M | 600.00K |
| Net Income | 112.70M | 61.70M | 49.70M | 35.00M | 34.30M | 34.30M | 75.90M | 74.10M | 67.90M | 83.80M | 30.20M | 50.10M | 29.90M | -51.30M | 88.10M | -736.00K | -500.00K | -200.00K | -1.30M | -6.90M | 200.00K | 200.00K | -1.30M | 500.00K | -3.60M | 100.00K | 2.70M | 2.10M | 3.70M | 600.00K |
| Net Income Ratio | 7.36% | 4.81% | 5.46% | 6.22% | 1.67% | 1.67% | 3.67% | 3.86% | 3.53% | 4.09% | 1.45% | 2.50% | 1.52% | -3.02% | 5.83% | -4.63% | -3.65% | -8.70% | -433.33% | -3,450.00% | 0.24% | 0.24% | -1.50% | 0.55% | -3.05% | 0.08% | 2.33% | 1.75% | 3.62% | 0.60% |
| EPS | 0.65 | 0.41 | 0.41 | 0.29 | 0.33 | 0.10 | 0.73 | 0.65 | 0.67 | 0.82 | 0.31 | 0.52 | 0.45 | -0.77 | 1.32 | -0.30 | -0.20 | -0.08 | -0.64 | -3.32 | 0.11 | 0.08 | -0.65 | 0.22 | -1.74 | 0.06 | 0.89 | 0.57 | 0.95 | 0.16 |
| EPS Diluted | 0.64 | 0.40 | 0.40 | 0.28 | 0.28 | 0.10 | 0.72 | 0.64 | 0.66 | 0.80 | 0.30 | 0.50 | 0.42 | -0.71 | 1.22 | -0.30 | -0.20 | -0.08 | -0.64 | -3.32 | 0.11 | 0.08 | -0.65 | 0.22 | -1.74 | 0.06 | 0.89 | 0.57 | 0.95 | 0.16 |
| Weighted Avg Shares Out | 174.25M | 151.58M | 121.49M | 120.43M | 104.64M | 104.64M | 103.89M | 102.75M | 100.84M | 101.53M | 98.11M | 95.97M | 66.75M | 66.72M | 66.72M | 2.47M | 2.50M | 2.50M | 2.03M | 2.08M | 1.82M | 2.50M | 2.00M | 2.27M | 2.07M | 1.67M | 3.03M | 3.68M | 3.89M | 3.75M |
| Weighted Avg Shares Out (Dil) | 177.26M | 153.84M | 125.11M | 123.20M | 123.33M | 123.33M | 106.00M | 104.78M | 103.31M | 104.73M | 101.32M | 99.87M | 72.07M | 71.99M | 71.99M | 2.47M | 2.50M | 2.50M | 2.03M | 2.08M | 1.82M | 2.50M | 2.00M | 2.27M | 2.07M | 1.67M | 3.03M | 3.68M | 3.89M | 3.75M |

Zurn Water Solutions Corporation (ZWS) CEO Todd Adams on Q2 2022 Results - Earnings Call Transcript

Zurn Water (ZWS) Q2 Earnings and Revenues Surpass Estimates

Zurn Elkay Water Solutions Reports Second Quarter 2022 Financial Results

Zurn Elkay Schedules Second Quarter 2022 Earnings Release and Investor Conference Call

7 Manufacturing Stocks to Buy for the Rest of 2022

Zurn Water Solutions Reports First Quarter 2022 Financial Results

SHAREHOLDER INVESTIGATION: Halper Sadeh LLP Investigates RCM, SAVE, ZWS, MGI

Zurn Schedules First Quarter 2022 Earnings Release and Investor Conference Call

SHAREHOLDER INVESTIGATION: Halper Sadeh LLP Investigates LAX, ZWS, MGI, SAVE, HBP

ENS or ZWS: Which Is the Better Value Stock Right Now?
Source: https://incomestatements.info
Category: Stock Reports
