See more : SysGroup plc (SYS.L) Income Statement Analysis – Financial Results
Complete financial analysis of Aurora Innovation, Inc. (AUR) income statement, including revenue, profit margins, EPS and key performance metrics. Get detailed insights into the financial performance of Aurora Innovation, Inc., a leading company in the Information Technology Services industry within the Technology sector.
- Sumitomo Corporation (SSUMF) Income Statement Analysis – Financial Results
- Sulliden Mining Capital Inc. (SMC.TO) Income Statement Analysis – Financial Results
- Brighthouse Financial, Inc. (BHFAP) Income Statement Analysis – Financial Results
- Indo-City Infotech Limited (INDOCITY.BO) Income Statement Analysis – Financial Results
- Dollar Tree, Inc. (0IC8.L) Income Statement Analysis – Financial Results
Aurora Innovation, Inc. (AUR)
About Aurora Innovation, Inc.
Aurora Innovation, Inc. operates as a self-driving technology company in the United States. It focuses on developing Aurora Driver, a platform that brings a suite of self-driving hardware, software, and data services together to adapt and interoperate passenger vehicles, light commercial vehicles, and trucks. The company was founded in 2017 and is headquartered in Pittsburgh, Pennsylvania.
| Metric | 2023 | 2022 | 2021 | 2020 | 2019 |
|---|---|---|---|---|---|
| Revenue | 0.00 | 68.00M | 82.54M | 0.00 | 19.60M |
| Cost of Revenue | 716.00M | 50.00M | 697.00M | 17.23M | 160.00K |
| Gross Profit | -716.00M | 18.00M | -614.46M | -17.23M | 19.44M |
| Gross Profit Ratio | 0.00% | 26.47% | -744.46% | 0.00% | 99.18% |
| Research & Development | 716.00M | 677.00M | 697.28M | 179.43M | 107.37M |
| General & Administrative | 0.00 | 0.00 | 0.00 | 0.00 | 0.00 |
| Selling & Marketing | 0.00 | 0.00 | 0.00 | 0.00 | 0.00 |
| SG&A | 119.00M | 129.00M | 115.93M | 38.69M | 25.59M |
| Other Expenses | 0.00 | 15.00M | -5.18M | -45.00K | -31.00K |
| Operating Expenses | 835.00M | 806.00M | 813.20M | 218.12M | 132.96M |
| Cost & Expenses | 835.00M | 806.00M | 813.20M | 218.12M | 133.12M |
| Interest Income | 59.00M | 15.00M | 525.00K | 3.72M | 11.70M |
| Interest Expense | 0.00 | 1.00B | 0.00 | 0.00 | 0.00 |
| Depreciation & Amortization | 48.00M | 50.00M | 41.01M | 17.23M | 1.84M |
| EBITDA | -748.00M | -716.00M | -718.95M | -197.22M | -111.68M |
| EBITDA Ratio | 0.00% | 417.65% | -836.52% | 0.00% | -569.77% |
| Operating Income | -835.00M | 262.00M | -730.66M | -218.12M | -113.52M |
| Operating Income Ratio | 0.00% | 385.29% | -885.24% | 0.00% | -579.14% |
| Total Other Income/Expenses | 39.00M | -985.00M | -28.95M | 3.67M | 11.67M |
| Income Before Tax | -796.00M | -1.72B | -759.95M | -214.45M | -101.85M |
| Income Before Tax Ratio | 0.00% | -2,533.82% | -920.73% | 0.00% | -519.61% |
| Income Tax Expense | 0.00 | 985.00M | -4.50M | 2.00K | -7.77M |
| Net Income | -796.00M | -2.71B | -755.45M | -214.45M | -94.08M |
| Net Income Ratio | 0.00% | -3,982.35% | -915.28% | 0.00% | -479.96% |
| EPS | -0.60 | -2.37 | -0.67 | -0.19 | -0.08 |
| EPS Diluted | -0.60 | -2.37 | -0.67 | -0.19 | -0.08 |
| Weighted Avg Shares Out | 1.33B | 1.14B | 1.12B | 1.12B | 1.12B |
| Weighted Avg Shares Out (Dil) | 1.33B | 1.14B | 1.12B | 1.12B | 1.12B |

Continental, Aurora to jointly develop self-driving systems for trucks

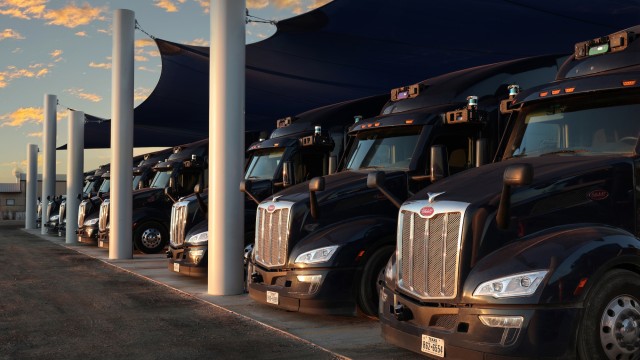
How Aurora is navigating the bumpy road to commercial self-driving trucks

The 3 Best AI Stocks to Buy Right Now

Aurora to Host First Quarter 2023 Business Review Conference Call on May 3, 2023

Union opposes driverless trucks exemption for Waymo, Aurora

Aurora to Present at Upcoming Investor Conferences

7 Penny Stocks to Buy and Hold for the Next Decade

Aurora Innovation: On Track To Launch By End Of 2024

Aurora Innovation, Inc. (AUR) Q4 2022 Earnings Call Transcript

Self-driving tech firm Aurora names Ossa Fisher as president
Source: https://incomestatements.info
Category: Stock Reports
