See more : Sovereign Metals Limited (SVMLF) Income Statement Analysis – Financial Results
Complete financial analysis of Aurora Innovation, Inc. (AUR) income statement, including revenue, profit margins, EPS and key performance metrics. Get detailed insights into the financial performance of Aurora Innovation, Inc., a leading company in the Information Technology Services industry within the Technology sector.
- Guangxi Nanning Waterworks Co.,Ltd. (601368.SS) Income Statement Analysis – Financial Results
- Nextensa NV/SA (NEXTA.BR) Income Statement Analysis – Financial Results
- Archidply Decor Limited (ADL.NS) Income Statement Analysis – Financial Results
- Surmodics, Inc. (SRDX) Income Statement Analysis – Financial Results
- S Foods Inc. (2292.T) Income Statement Analysis – Financial Results
Aurora Innovation, Inc. (AUR)
About Aurora Innovation, Inc.
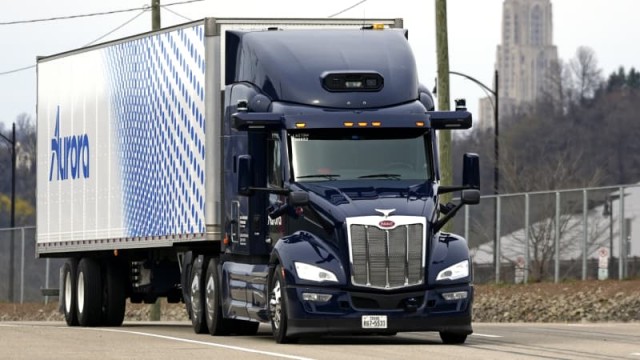
Aurora Innovation, Inc. operates as a self-driving technology company in the United States. It focuses on developing Aurora Driver, a platform that brings a suite of self-driving hardware, software, and data services together to adapt and interoperate passenger vehicles, light commercial vehicles, and trucks. The company was founded in 2017 and is headquartered in Pittsburgh, Pennsylvania.
| Metric | 2023 | 2022 | 2021 | 2020 | 2019 |
|---|---|---|---|---|---|
| Revenue | 0.00 | 68.00M | 82.54M | 0.00 | 19.60M |
| Cost of Revenue | 716.00M | 50.00M | 697.00M | 17.23M | 160.00K |
| Gross Profit | -716.00M | 18.00M | -614.46M | -17.23M | 19.44M |
| Gross Profit Ratio | 0.00% | 26.47% | -744.46% | 0.00% | 99.18% |
| Research & Development | 716.00M | 677.00M | 697.28M | 179.43M | 107.37M |
| General & Administrative | 0.00 | 0.00 | 0.00 | 0.00 | 0.00 |
| Selling & Marketing | 0.00 | 0.00 | 0.00 | 0.00 | 0.00 |
| SG&A | 119.00M | 129.00M | 115.93M | 38.69M | 25.59M |
| Other Expenses | 0.00 | 15.00M | -5.18M | -45.00K | -31.00K |
| Operating Expenses | 835.00M | 806.00M | 813.20M | 218.12M | 132.96M |
| Cost & Expenses | 835.00M | 806.00M | 813.20M | 218.12M | 133.12M |
| Interest Income | 59.00M | 15.00M | 525.00K | 3.72M | 11.70M |
| Interest Expense | 0.00 | 1.00B | 0.00 | 0.00 | 0.00 |
| Depreciation & Amortization | 48.00M | 50.00M | 41.01M | 17.23M | 1.84M |
| EBITDA | -748.00M | -716.00M | -718.95M | -197.22M | -111.68M |
| EBITDA Ratio | 0.00% | 417.65% | -836.52% | 0.00% | -569.77% |
| Operating Income | -835.00M | 262.00M | -730.66M | -218.12M | -113.52M |
| Operating Income Ratio | 0.00% | 385.29% | -885.24% | 0.00% | -579.14% |
| Total Other Income/Expenses | 39.00M | -985.00M | -28.95M | 3.67M | 11.67M |
| Income Before Tax | -796.00M | -1.72B | -759.95M | -214.45M | -101.85M |
| Income Before Tax Ratio | 0.00% | -2,533.82% | -920.73% | 0.00% | -519.61% |
| Income Tax Expense | 0.00 | 985.00M | -4.50M | 2.00K | -7.77M |
| Net Income | -796.00M | -2.71B | -755.45M | -214.45M | -94.08M |
| Net Income Ratio | 0.00% | -3,982.35% | -915.28% | 0.00% | -479.96% |
| EPS | -0.60 | -2.37 | -0.67 | -0.19 | -0.08 |
| EPS Diluted | -0.60 | -2.37 | -0.67 | -0.19 | -0.08 |
| Weighted Avg Shares Out | 1.33B | 1.14B | 1.12B | 1.12B | 1.12B |
| Weighted Avg Shares Out (Dil) | 1.33B | 1.14B | 1.12B | 1.12B | 1.12B |

Penny Stocks That Insiders Are Loading Up On: 3 Names to Watch Closely

The Hidden Gem Hit List: 3 Under-the-Radar Stocks to Buy Before Wall Street Wises Up

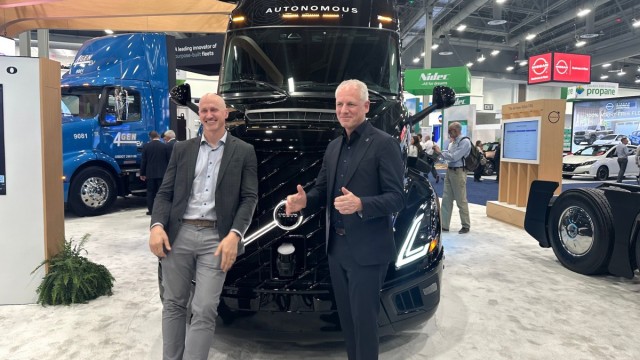
The Volvo VNL Autonomous – Proving the Way Forward

The Volvo VNL Autonomous – Proving the Way Forward

Aurora and Volvo unveil self-driving truck designed for a driverless future

Aurora Innovation, Inc. (AUR) Q1 2024 Business Review Call Transcript

Aurora to Present at TD Cowen's 2nd Annual Sustainability Week

Research: Autonomous Trucks Can Reduce Emissions and Fight Climate Change

Tractor-trailers with no one aboard? The future is near for self-driving trucks on US roads.

Aurora to Host First Quarter 2024 Business Review Conference Call on May 8, 2024
Source: https://incomestatements.info
Category: Stock Reports
