See more : Lion Energy Limited (LIO.AX) Income Statement Analysis – Financial Results
Complete financial analysis of Aurora Innovation, Inc. (AUR) income statement, including revenue, profit margins, EPS and key performance metrics. Get detailed insights into the financial performance of Aurora Innovation, Inc., a leading company in the Information Technology Services industry within the Technology sector.
- AUTOWAVE Co., Ltd. (2666.T) Income Statement Analysis – Financial Results
- Powerchip Semiconductor Manufacturing Corp. (6770.TW) Income Statement Analysis – Financial Results
- Syncom Healthcare Limited (SYNCOM.NS) Income Statement Analysis – Financial Results
- Aerkomm Inc. (AKOM.PA) Income Statement Analysis – Financial Results
- Yingkou Jinchen Machinery Co., Ltd. (603396.SS) Income Statement Analysis – Financial Results
Aurora Innovation, Inc. (AUR)
About Aurora Innovation, Inc.
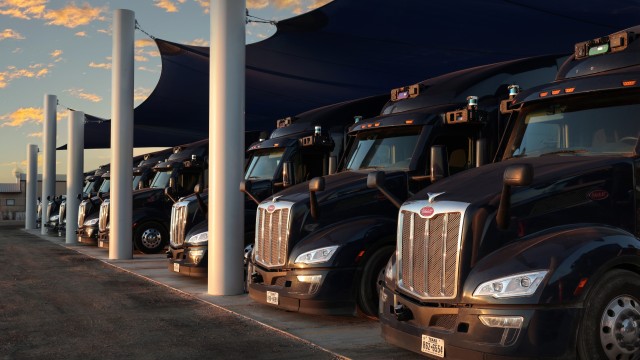
Aurora Innovation, Inc. operates as a self-driving technology company in the United States. It focuses on developing Aurora Driver, a platform that brings a suite of self-driving hardware, software, and data services together to adapt and interoperate passenger vehicles, light commercial vehicles, and trucks. The company was founded in 2017 and is headquartered in Pittsburgh, Pennsylvania.
| Metric | 2023 | 2022 | 2021 | 2020 | 2019 |
|---|---|---|---|---|---|
| Revenue | 0.00 | 68.00M | 82.54M | 0.00 | 19.60M |
| Cost of Revenue | 716.00M | 50.00M | 697.00M | 17.23M | 160.00K |
| Gross Profit | -716.00M | 18.00M | -614.46M | -17.23M | 19.44M |
| Gross Profit Ratio | 0.00% | 26.47% | -744.46% | 0.00% | 99.18% |
| Research & Development | 716.00M | 677.00M | 697.28M | 179.43M | 107.37M |
| General & Administrative | 0.00 | 0.00 | 0.00 | 0.00 | 0.00 |
| Selling & Marketing | 0.00 | 0.00 | 0.00 | 0.00 | 0.00 |
| SG&A | 119.00M | 129.00M | 115.93M | 38.69M | 25.59M |
| Other Expenses | 0.00 | 15.00M | -5.18M | -45.00K | -31.00K |
| Operating Expenses | 835.00M | 806.00M | 813.20M | 218.12M | 132.96M |
| Cost & Expenses | 835.00M | 806.00M | 813.20M | 218.12M | 133.12M |
| Interest Income | 59.00M | 15.00M | 525.00K | 3.72M | 11.70M |
| Interest Expense | 0.00 | 1.00B | 0.00 | 0.00 | 0.00 |
| Depreciation & Amortization | 48.00M | 50.00M | 41.01M | 17.23M | 1.84M |
| EBITDA | -748.00M | -716.00M | -718.95M | -197.22M | -111.68M |
| EBITDA Ratio | 0.00% | 417.65% | -836.52% | 0.00% | -569.77% |
| Operating Income | -835.00M | 262.00M | -730.66M | -218.12M | -113.52M |
| Operating Income Ratio | 0.00% | 385.29% | -885.24% | 0.00% | -579.14% |
| Total Other Income/Expenses | 39.00M | -985.00M | -28.95M | 3.67M | 11.67M |
| Income Before Tax | -796.00M | -1.72B | -759.95M | -214.45M | -101.85M |
| Income Before Tax Ratio | 0.00% | -2,533.82% | -920.73% | 0.00% | -519.61% |
| Income Tax Expense | 0.00 | 985.00M | -4.50M | 2.00K | -7.77M |
| Net Income | -796.00M | -2.71B | -755.45M | -214.45M | -94.08M |
| Net Income Ratio | 0.00% | -3,982.35% | -915.28% | 0.00% | -479.96% |
| EPS | -0.60 | -2.37 | -0.67 | -0.19 | -0.08 |
| EPS Diluted | -0.60 | -2.37 | -0.67 | -0.19 | -0.08 |
| Weighted Avg Shares Out | 1.33B | 1.14B | 1.12B | 1.12B | 1.12B |
| Weighted Avg Shares Out (Dil) | 1.33B | 1.14B | 1.12B | 1.12B | 1.12B |

Aurora to Present at the Goldman Sachs Communacopia + Technology Conference

Inside Aurora's autonomous trucking operation in Texas

3 Cheap Autonomous Driving Stocks That Smart Investors Will Snap Up Now

Aurora to Present at the Canaccord Genuity 43rd Annual Growth Conference

Aurora Innovation, Inc. (AUR) Q2 2023 Earnings Call Transcript

Aurora Announces Second Quarter 2023 Results

Buy Alert: 3 Autonomous Driving Stocks Nearing Super Attractive Entry Points

2 AI Stocks Up Over 100% This Year That I Would Still Buy

3 Autonomous Driving Stocks You Better Be Buying on Each and Every Dip

Aurora Announces Closing of $820 Million Upsized Public Offering and Private Placement of Class A Common Stock
Source: https://incomestatements.info
Category: Stock Reports
