See more : Newcrest Mining Limited (NCMGF) Income Statement Analysis – Financial Results
Complete financial analysis of Aurora Innovation, Inc. (AUR) income statement, including revenue, profit margins, EPS and key performance metrics. Get detailed insights into the financial performance of Aurora Innovation, Inc., a leading company in the Information Technology Services industry within the Technology sector.
- Orford Mining Corporation (ORMFF) Income Statement Analysis – Financial Results
- New China Life Insurance Company Ltd. (1336.HK) Income Statement Analysis – Financial Results
- Vegano Foods Inc. (VAGN.CN) Income Statement Analysis – Financial Results
- MRS Logística S.A. (MRSA5B.SA) Income Statement Analysis – Financial Results
- Empresas CMPC S.A. (CMPC.SN) Income Statement Analysis – Financial Results
Aurora Innovation, Inc. (AUR)
About Aurora Innovation, Inc.
Aurora Innovation, Inc. operates as a self-driving technology company in the United States. It focuses on developing Aurora Driver, a platform that brings a suite of self-driving hardware, software, and data services together to adapt and interoperate passenger vehicles, light commercial vehicles, and trucks. The company was founded in 2017 and is headquartered in Pittsburgh, Pennsylvania.
| Metric | 2023 | 2022 | 2021 | 2020 | 2019 |
|---|---|---|---|---|---|
| Revenue | 0.00 | 68.00M | 82.54M | 0.00 | 19.60M |
| Cost of Revenue | 716.00M | 50.00M | 697.00M | 17.23M | 160.00K |
| Gross Profit | -716.00M | 18.00M | -614.46M | -17.23M | 19.44M |
| Gross Profit Ratio | 0.00% | 26.47% | -744.46% | 0.00% | 99.18% |
| Research & Development | 716.00M | 677.00M | 697.28M | 179.43M | 107.37M |
| General & Administrative | 0.00 | 0.00 | 0.00 | 0.00 | 0.00 |
| Selling & Marketing | 0.00 | 0.00 | 0.00 | 0.00 | 0.00 |
| SG&A | 119.00M | 129.00M | 115.93M | 38.69M | 25.59M |
| Other Expenses | 0.00 | 15.00M | -5.18M | -45.00K | -31.00K |
| Operating Expenses | 835.00M | 806.00M | 813.20M | 218.12M | 132.96M |
| Cost & Expenses | 835.00M | 806.00M | 813.20M | 218.12M | 133.12M |
| Interest Income | 59.00M | 15.00M | 525.00K | 3.72M | 11.70M |
| Interest Expense | 0.00 | 1.00B | 0.00 | 0.00 | 0.00 |
| Depreciation & Amortization | 48.00M | 50.00M | 41.01M | 17.23M | 1.84M |
| EBITDA | -748.00M | -716.00M | -718.95M | -197.22M | -111.68M |
| EBITDA Ratio | 0.00% | 417.65% | -836.52% | 0.00% | -569.77% |
| Operating Income | -835.00M | 262.00M | -730.66M | -218.12M | -113.52M |
| Operating Income Ratio | 0.00% | 385.29% | -885.24% | 0.00% | -579.14% |
| Total Other Income/Expenses | 39.00M | -985.00M | -28.95M | 3.67M | 11.67M |
| Income Before Tax | -796.00M | -1.72B | -759.95M | -214.45M | -101.85M |
| Income Before Tax Ratio | 0.00% | -2,533.82% | -920.73% | 0.00% | -519.61% |
| Income Tax Expense | 0.00 | 985.00M | -4.50M | 2.00K | -7.77M |
| Net Income | -796.00M | -2.71B | -755.45M | -214.45M | -94.08M |
| Net Income Ratio | 0.00% | -3,982.35% | -915.28% | 0.00% | -479.96% |
| EPS | -0.60 | -2.37 | -0.67 | -0.19 | -0.08 |
| EPS Diluted | -0.60 | -2.37 | -0.67 | -0.19 | -0.08 |
| Weighted Avg Shares Out | 1.33B | 1.14B | 1.12B | 1.12B | 1.12B |
| Weighted Avg Shares Out (Dil) | 1.33B | 1.14B | 1.12B | 1.12B | 1.12B |

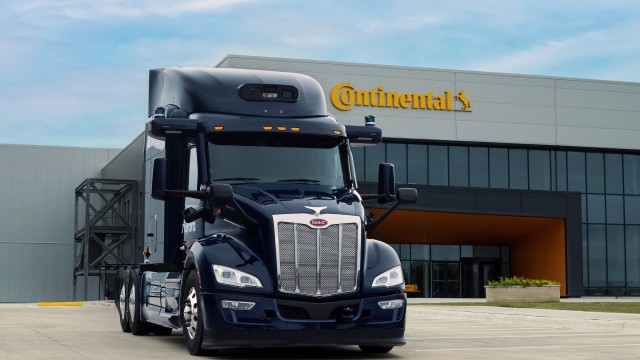
Aurora and Continental pass first major hurdle in commercial self-driving trucks deal

Continental and Aurora Finalize Design of World's First Scalable Autonomous Trucking System

3 Long-Term Stocks You'll Regret Not Buying Soon: December Edition

Bull Run Bonanza: Top 3 Penny Stocks Primed for Explosive Growth

3 Stocks Poised to Benefit from the Rise of Autonomous Delivery

Aurora to Present at the Barclays Global Automotive and Mobility Tech Conference

Aurora to Present at the D.A. Davidson Technology Summit

Aurora Innovation, Inc. (AUR) Q3 2023 Earnings Call Transcript

Aurora Announces Third Quarter 2023 Results

Aurora Opens First Commercial-Ready Route for its Planned Driverless Truck Launch in Late 2024
Source: https://incomestatements.info
Category: Stock Reports
