See more : RF Capital Group Inc. (GMPXF) Income Statement Analysis – Financial Results
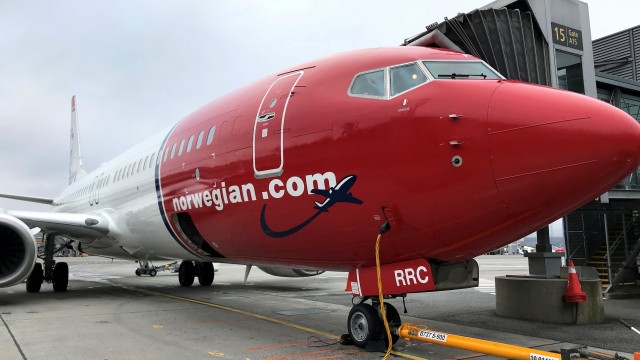
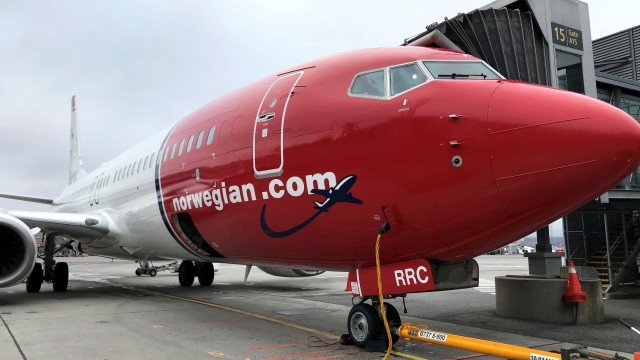
Complete financial analysis of Norwegian Air Shuttle ASA (NWARF) income statement, including revenue, profit margins, EPS and key performance metrics. Get detailed insights into the financial performance of Norwegian Air Shuttle ASA, a leading company in the Airlines, Airports & Air Services industry within the Industrials sector.
- Envirotech Vehicles, Inc. (EVTV) Income Statement Analysis – Financial Results
- Direct Marketing MiX Inc. (7354.T) Income Statement Analysis – Financial Results
- Midatech Pharma plc (MTP) Income Statement Analysis – Financial Results
- GERRY WEBER International AG (GWI2.DE) Income Statement Analysis – Financial Results
- Southern Energy Corp. (SOU.V) Income Statement Analysis – Financial Results
Norwegian Air Shuttle ASA (NWARF)
About Norwegian Air Shuttle ASA
Norwegian Air Shuttle ASA, together with its subsidiaries, provides scheduled and charter airline services in Norway and internationally. As of December 31, 2021, the company operated a fleet of 70 aircraft. It is also involved in aircraft financing, leasing, and ownership activities; and cargo activities. Norwegian Air Shuttle ASA was founded in 1993 and is headquartered in Fornebu, Norway.
| Metric | 2023 | 2022 | 2021 | 2020 | 2019 | 2018 | 2017 | 2016 | 2015 | 2014 | 2013 | 2012 | 2011 | 2010 | 2009 | 2008 | 2007 | 2006 | 2005 | 2004 | 2003 | 2002 |
|---|---|---|---|---|---|---|---|---|---|---|---|---|---|---|---|---|---|---|---|---|---|---|
| Revenue | 25.54B | 18.87B | 5.07B | 9.10B | 43.52B | 40.27B | 30.95B | 26.05B | 22.49B | 19.54B | 15.58B | 12.86B | 10.53B | 8.41B | 7.31B | 6.23B | 4.23B | 2.94B | 1.97B | 1.21B | 958.61M | 386.48M |
| Cost of Revenue | 20.10B | 16.97B | 6.81B | 14.49B | 38.66B | 40.42B | 29.80B | 22.53B | 19.79B | 18.85B | 14.04B | 11.31B | 7.82B | 6.30B | 4.94B | 4.89B | 2.85B | 2.12B | 1.01B | 726.46M | 0.00 | 0.00 |
| Gross Profit | 5.44B | 1.90B | -1.75B | -5.40B | 4.86B | -152.20M | 1.15B | 3.52B | 2.70B | 691.90M | 1.54B | 1.55B | 2.71B | 2.10B | 2.37B | 1.33B | 1.37B | 823.69M | 966.23M | 483.60M | 958.61M | 386.48M |
| Gross Profit Ratio | 21.29% | 10.07% | -34.46% | -59.33% | 11.17% | -0.38% | 3.72% | 13.52% | 11.99% | 3.54% | 9.89% | 12.05% | 25.74% | 25.04% | 32.44% | 21.42% | 32.47% | 28.00% | 48.99% | 39.96% | 100.00% | 100.00% |
| Research & Development | 0.00 | 0.00 | 0.00 | 0.00 | 0.00 | 0.00 | 0.00 | 0.00 | 0.00 | 0.00 | 0.00 | 0.00 | 0.00 | 0.00 | 0.00 | 0.00 | 0.00 | 0.00 | 0.00 | 0.00 | 0.00 | 0.00 |
| General & Administrative | 917.50M | 742.30M | 901.80M | 1.17B | 2.00B | 1.92B | 0.00 | 0.00 | 0.00 | 0.00 | 0.00 | 0.00 | 0.00 | 0.00 | 0.00 | 4.89B | -91.87M | -92.37M | 132.67M | 64.20M | 925.42M | 406.59M |
| Selling & Marketing | 716.30M | 576.50M | 165.30M | 274.20M | 1.07B | 878.50M | 946.07M | 758.70M | 612.29M | 469.11M | 339.38M | 274.95M | 198.93M | 0.00 | 0.00 | 0.00 | 94.16M | 92.89M | 75.11M | 88.05M | 0.00 | 0.00 |
| SG&A | 1.63B | 1.32B | 1.07B | 1.45B | 3.07B | 878.50M | 946.07M | 758.70M | 612.29M | 469.11M | 339.38M | 274.95M | 198.93M | 0.00 | 0.00 | 4.89B | 2.29M | 515.00K | 207.79M | 152.25M | 925.42M | 406.59M |
| Other Expenses | 1.57B | 1.19B | 710.00M | 1.11B | 1.78B | 695.60M | 0.00 | 0.00 | 0.00 | 0.00 | 0.00 | 0.00 | 0.00 | 0.00 | 0.00 | 0.00 | 3.64M | 0.00 | 0.00 | 0.00 | 0.00 | 0.00 |
| Operating Expenses | 3.20B | 2.50B | 1.78B | 2.55B | 4.85B | 2.70B | 2.93B | 2.28B | 1.88B | 1.52B | 1.07B | 809.29M | 2.60B | 1.89B | 1.80B | 6.56B | 1.24B | 854.20M | 936.95M | 642.15M | 1.02B | 460.27M |
| Cost & Expenses | 23.31B | 19.47B | 8.59B | 17.04B | 43.51B | 43.12B | 32.73B | 24.81B | 21.67B | 20.37B | 15.11B | 12.12B | 10.42B | 8.20B | 6.74B | 6.56B | 4.09B | 2.97B | 1.94B | 1.37B | 1.02B | 460.27M |
| Interest Income | 231.30M | 72.60M | 13.70M | 68.20M | 204.50M | 117.50M | 71.30M | 43.63M | 74.18M | 196.27M | 149.66M | 47.54M | 35.67M | 0.00 | 0.00 | 0.00 | 21.83M | 6.80M | 4.01M | 4.33M | 3.75M | 2.44M |
| Interest Expense | 848.00M | 650.00M | 682.30M | 2.69B | 3.11B | 1.16B | 958.62M | 685.99M | 463.35M | 447.24M | 256.70M | 118.85M | 70.25M | 0.00 | 0.00 | 0.00 | 19.14M | 609.00K | 648.00K | 844.00K | 0.00 | 0.00 |
| Depreciation & Amortization | 3.53B | 1.85B | 1.27B | 6.20B | 6.46B | 1.67B | 1.41B | 1.30B | 1.13B | 748.14M | 529.83M | 385.24M | 293.95M | 186.71M | 148.88M | 129.61M | 74.04M | 51.07M | 29.32M | 19.00M | 34.37M | 5.81M |
| EBITDA | 6.19B | 933.80M | -1.92B | -13.23B | 6.92B | 337.00M | -198.50M | 2.89B | 1.67B | -618.29M | 1.22B | 1.13B | 530.74M | 396.88M | 720.75M | -208.24M | 208.00M | 19.97M | 68.90M | -132.61M | -23.82M | -67.98M |
| EBITDA Ratio | 24.22% | 4.95% | -37.95% | -35.25% | 15.91% | 3.56% | -1.26% | 11.10% | 11.95% | 0.20% | 6.22% | 11.10% | 3.84% | 4.72% | 9.86% | -3.34% | 4.62% | 0.68% | 3.49% | -10.87% | -2.49% | -17.59% |
| Operating Income | 2.23B | -468.50M | -2.79B | -23.77B | 467.00M | -3.85B | -2.00B | 1.82B | 347.78M | -1.41B | 969.66M | 403.45M | 415.93M | 210.17M | 571.87M | -337.85M | 133.95M | -30.51M | 29.28M | -159.60M | -58.19M | -73.79M |
| Operating Income Ratio | 8.74% | -2.48% | -54.97% | -261.32% | 1.07% | -9.56% | -6.47% | 6.99% | 1.55% | -7.22% | 6.22% | 3.14% | 3.95% | 2.50% | 7.82% | -5.43% | 3.17% | -1.04% | 1.48% | -13.19% | -6.07% | -19.09% |
| Total Other Income/Expenses | -428.20M | -455.80M | 4.66B | 1.64B | -2.54B | 1.36B | -560.10M | -312.05M | -272.74M | -216.51M | -532.28M | 225.33M | -249.39M | 32.93M | 51.17M | 343.19M | -20.97M | -1.20M | 9.66M | 7.14M | 15.44M | 21.93M |
| Income Before Tax | 1.80B | 1.05B | 1.88B | -22.13B | -1.69B | -2.49B | -2.56B | 1.51B | 75.04M | -1.63B | 437.38M | 623.18M | 166.54M | 243.10M | 623.04M | 5.34M | 112.98M | -31.71M | 38.94M | -152.46M | -42.75M | -51.86M |
| Income Before Tax Ratio | 7.06% | 5.55% | 37.02% | -243.34% | -3.88% | -6.18% | -8.28% | 5.79% | 0.33% | -8.33% | 2.81% | 4.85% | 1.58% | 2.89% | 8.52% | 0.09% | 2.67% | -1.08% | 1.97% | -12.60% | -4.46% | -13.42% |
| Income Tax Expense | 66.90M | 41.00M | 5.50M | 906.80M | -78.50M | -1.04B | -768.50M | 373.35M | -171.11M | -557.28M | 115.82M | 166.54M | 44.42M | 72.21M | 176.79M | 1.39M | 28.40M | -9.71M | 10.96M | -42.62M | 16.27M | 19.89M |
| Net Income | 1.74B | 1.01B | 1.87B | -23.04B | -1.61B | -1.46B | -1.79B | 1.14B | 246.15M | -1.07B | 321.56M | 456.65M | 122.13M | 170.88M | 446.25M | 3.94M | 84.58M | -22.00M | 27.98M | -109.84M | -42.75M | -51.86M |
| Net Income Ratio | 6.80% | 5.33% | 36.91% | -253.31% | -3.70% | -3.63% | -5.80% | 4.36% | 1.09% | -5.47% | 2.06% | 3.55% | 1.16% | 2.03% | 6.11% | 0.06% | 2.00% | -0.75% | 1.42% | -9.08% | -4.46% | -13.42% |
| EPS | 1.43 | 0.99 | 3.58 | -477.22 | -587.67 | -923.80 | -7.75K | 847.35 | 186.55 | -811.96 | 244.20 | 349.08 | 94.21 | 132.64 | 347.21 | 4.00 | 100.61 | -30.40 | 40.83 | -160.85 | -108.12 | -200.19 |
| EPS Diluted | 1.43 | 0.82 | 2.68 | -477.22 | -587.67 | -923.80 | -7.75K | 847.35 | 186.55 | -797.78 | 244.20 | 349.08 | 94.21 | 129.97 | 344.01 | 4.00 | 100.61 | -30.17 | 40.83 | -159.57 | -108.12 | -200.19 |
| Weighted Avg Shares Out | 1.13B | 929.58M | 522.79M | 48.28M | 2.74M | 1.58M | 231.47K | 1.34M | 1.32M | 1.32M | 1.32M | 1.31M | 1.30M | 1.28M | 1.22M | 956.46K | 756.74K | 723.64K | 685.11K | 682.88K | 395.34K | 259.05K |
| Weighted Avg Shares Out (Dil) | 1.13B | 1.13B | 698.55M | 48.28M | 2.74M | 1.58M | 231.47K | 1.35M | 1.33M | 1.34M | 1.34M | 1.32M | 1.32M | 1.31M | 1.25M | 1.02M | 780.53K | 729.03K | 686.34K | 688.35K | 395.34K | 259.05K |

Norwegian Air Shuttle ASA (NWARF) Q3 2024 Earnings Call Transcript

Norwegian Air Shuttle ASA (NWARF) Q2 2024 Earnings Call Transcript

Norwegian Air Shuttle Stock: Significant Upside Remains For Huge Turnaround Story

Norwegian Air Shuttle ASA (NWARF) Q4 2023 Earnings Call Transcript

Norwegian Air Shuttle Stock: Reiterating Buy Rating On Strong Growth

Norwegian watchdog might stop Norwegian Air's bid for Wideroe

Norway may block Norwegian Air's bid for Wideroe

Norwegian Air Q3 beats forecast

Norwegian Air Shuttle: A Speculative Growth And Turnaround Buy

Norwegian Air feeling more positive on Boeing MAX 10, CEO says
Source: https://incomestatements.info
Category: Stock Reports
