See more : Avadel Pharmaceuticals plc (AVDL) Income Statement Analysis – Financial Results
Complete financial analysis of Talon Metals Corp. (TLOFF) income statement, including revenue, profit margins, EPS and key performance metrics. Get detailed insights into the financial performance of Talon Metals Corp., a leading company in the Industrial Materials industry within the Basic Materials sector.
- Authentic Equity Acquisition Corp. (AEAC) Income Statement Analysis – Financial Results
- Pelangio Exploration Inc. (PX.V) Income Statement Analysis – Financial Results
- KONNDOR INDUSTRIES LIMITED (KONNDOR.BO) Income Statement Analysis – Financial Results
- RF Acquisition Corp. (RFACR) Income Statement Analysis – Financial Results
- Fennec Pharmaceuticals Inc. (FRX.TO) Income Statement Analysis – Financial Results
Talon Metals Corp. (TLOFF)
About Talon Metals Corp.
Talon Metals Corp., a mineral exploration company, explores for and develops mineral properties. The company owns a 17.56% interest is the Tamarack nickel-copper-cobalt project located in Minnesota, the United States. It has an option to acquire 80% interest in the mineral rights over a land package covering an area of approximately 4,00,000 acres located in the Upper Peninsula of the State of Michigan. The company is headquartered in Road Town, the British Virgin Islands.
| Metric | 2023 | 2022 | 2021 | 2020 | 2019 | 2018 | 2017 | 2016 | 2015 | 2014 | 2013 | 2012 | 2011 | 2010 | 2009 | 2008 | 2007 | 2006 | 2005 | 2004 |
|---|---|---|---|---|---|---|---|---|---|---|---|---|---|---|---|---|---|---|---|---|
| Revenue | 0.00 | 0.00 | 0.00 | 0.00 | 0.00 | 0.00 | 0.00 | 0.00 | 0.00 | 0.00 | 0.00 | 0.00 | 1.29M | 4.23M | 0.00 | 124.65K | 415.31K | 427.93K | 52.07K | 0.00 |
| Cost of Revenue | 50.52K | 36.11K | 13.90K | 8.96K | 10.30K | 5.97K | 9.90K | 20.35K | 57.42K | 39.38K | 21.99K | 35.55K | 34.87K | 0.00 | 0.00 | 0.00 | 0.00 | 0.00 | 392.52K | 223.83K |
| Gross Profit | -50.52K | -36.11K | -13.90K | -8.96K | -10.30K | -5.97K | -9.90K | -20.35K | -57.42K | -39.38K | -21.99K | -35.55K | 1.25M | 4.23M | 0.00 | 124.65K | 415.31K | 427.93K | -340.44K | -223.83K |
| Gross Profit Ratio | 0.00% | 0.00% | 0.00% | 0.00% | 0.00% | 0.00% | 0.00% | 0.00% | 0.00% | 0.00% | 0.00% | 0.00% | 97.29% | 100.00% | 0.00% | 100.00% | 100.00% | 100.00% | -653.78% | 0.00% |
| Research & Development | 0.00 | 0.00 | 0.00 | 0.00 | 0.00 | 0.00 | 0.00 | 0.00 | 0.00 | 0.00 | 0.00 | 0.00 | 0.00 | 0.00 | 0.00 | 0.00 | 0.00 | 0.00 | 0.00 | 0.00 |
| General & Administrative | 533.38K | 3.49M | 6.02M | 2.11M | 3.33M | 817.02K | 668.08K | 923.95K | 2.41M | 2.02M | 2.06M | 5.67M | 11.50M | 6.86M | 3.12M | 2.05M | 1.77M | 0.00 | 0.00 | 0.00 |
| Selling & Marketing | 355.09K | 441.81K | 234.84K | 264.95K | 86.08K | 0.00 | 0.00 | 0.00 | 0.00 | 0.00 | 0.00 | 0.00 | 0.00 | 0.00 | 0.00 | 0.00 | 100.78K | 0.00 | 0.00 | 0.00 |
| SG&A | 2.41M | 3.94M | 6.25M | 2.38M | 3.42M | 817.02K | 668.08K | 923.95K | 2.41M | 2.02M | 2.06M | 5.67M | 11.50M | 6.86M | 3.12M | 2.05M | 1.87M | 2.21M | 2.43M | 70.78K |
| Other Expenses | 0.00 | 0.00 | 0.00 | 0.00 | 54.73K | -8.42M | 7.91K | 0.00 | 2.44M | -40.64K | 0.00 | 0.00 | 196.28K | 0.00 | 0.00 | 0.00 | 0.00 | 0.00 | 0.00 | 0.00 |
| Operating Expenses | 2.41M | 3.97M | 6.26M | 2.38M | 3.43M | 817.02K | 668.08K | 923.95K | 2.11M | 2.93M | 4.73M | 5.70M | 11.53M | 6.88M | 3.14M | 2.17M | 1.99M | 2.21M | 2.43M | 71.73K |
| Cost & Expenses | 2.41M | 3.97M | 6.26M | 2.38M | 3.44M | 822.99K | 677.98K | 944.30K | 2.17M | 2.97M | 4.75M | 5.73M | 11.53M | 6.88M | 3.14M | 2.17M | 1.99M | 2.21M | 2.83M | 295.56K |
| Interest Income | 968.52K | 266.28K | 15.34K | 14.59K | 17.98K | 3.00K | 4.24K | 3.16K | 6.31K | 46.96K | 75.54K | 200.34K | 810.40K | 73.51K | 12.66K | 270.64K | 415.31K | 427.93K | 0.00 | 0.00 |
| Interest Expense | 0.00 | 0.00 | 0.00 | 0.00 | 31.40K | 149.04K | 0.00 | 0.00 | 0.00 | 0.00 | 0.00 | 0.00 | 168.41K | 28.46K | 53.71K | 103.68K | 99.44K | 55.68K | 20.83K | 1.98K |
| Depreciation & Amortization | 50.52K | 36.11K | 13.90K | 8.96K | 22.63K | 5.97K | 9.90K | 20.35K | 57.42K | 39.38K | 21.99K | 35.55K | 34.87K | 23.12K | 20.00K | 20.00K | 17.94K | 6.00K | 3.28K | 948.00 |
| EBITDA | -2.36M | -3.51M | -6.04M | -2.37M | -3.33M | -761.55K | -655.94K | -862.22K | 3.86M | 11.36M | -4.77M | 5.07M | -6.92M | -2.55M | -3.11M | -6.71M | -1.56M | -1.78M | -2.77M | -294.61K |
| EBITDA Ratio | 0.00% | 0.00% | 0.00% | 0.00% | 0.00% | 0.00% | 0.00% | 0.00% | 0.00% | 0.00% | 0.00% | 0.00% | -538.49% | -62.75% | 0.00% | -1,404.18% | -374.66% | -415.37% | -5,321.01% | 0.00% |
| Operating Income | -2.41M | -6.18M | -6.97M | -2.37M | -3.50M | -820.00K | 1.81M | 941.15K | 2.46M | 3.02M | 2.01M | 5.58M | -6.96M | 2.57M | 3.21M | 1.77M | 1.57M | 1.78M | 2.77M | 295.56K |
| Operating Income Ratio | 0.00% | 0.00% | 0.00% | 0.00% | 0.00% | 0.00% | 0.00% | 0.00% | 0.00% | 0.00% | 0.00% | 0.00% | -541.21% | 60.79% | 0.00% | 1,420.22% | 378.98% | 416.77% | 5,327.30% | 0.00% |
| Total Other Income/Expenses | 65.15K | 2.04M | 504.01K | -448.73K | -647.69K | -8.68M | -2.51M | -503.25K | -4.00M | -14.34M | -1.14M | -23.98M | 34.87K | -6.92M | -5.05M | -8.60M | 8.32M | -1.78M | -2.77M | 0.00 |
| Income Before Tax | -2.35M | -1.50M | -5.55M | -2.73M | -3.98M | -9.44M | -3.15M | -1.37M | -6.30M | -17.25M | -7.17M | -18.40M | -10.25M | -4.35M | -1.84M | -6.83M | 9.90M | 1.65M | 2.76M | 0.00 |
| Income Before Tax Ratio | 0.00% | 0.00% | 0.00% | 0.00% | 0.00% | 0.00% | 0.00% | 0.00% | 0.00% | 0.00% | 0.00% | 0.00% | -797.07% | -102.63% | 0.00% | -5,481.88% | 2,383.23% | 384.75% | 5,305.86% | 0.00% |
| Income Tax Expense | 0.00 | -2.51M | -732.29K | -8.96K | 86.13K | 149.04K | 2.48M | 421.18K | 6.57M | 14.24M | 2.20M | 10.56M | 2.84M | -100.49K | 53.71K | 103.68K | -3.66K | 55.68K | 72.90K | 1.98K |
| Net Income | -2.35M | -1.50M | -5.55M | -2.73M | -3.98M | -9.44M | -3.15M | -1.37M | -6.30M | -17.25M | -7.17M | -18.40M | -13.08M | -4.32M | -1.84M | -6.83M | 6.75M | -1.98M | -2.86M | -297.54K |
| Net Income Ratio | 0.00% | 0.00% | 0.00% | 0.00% | 0.00% | 0.00% | 0.00% | 0.00% | 0.00% | 0.00% | 0.00% | 0.00% | -1,017.76% | -102.09% | 0.00% | -5,481.88% | 1,626.16% | -461.81% | -5,488.73% | 0.00% |
| EPS | 0.00 | 0.00 | -0.01 | -0.01 | -0.01 | -0.07 | -0.02 | -0.01 | -0.06 | -0.18 | -0.08 | -0.20 | -0.15 | -0.08 | -0.07 | -0.25 | 0.25 | -0.08 | -0.17 | -0.05 |
| EPS Diluted | 0.00 | 0.00 | -0.01 | -0.01 | -0.01 | -0.07 | -0.02 | -0.01 | -0.06 | -0.18 | -0.08 | -0.20 | -0.15 | -0.08 | -0.07 | -0.25 | 0.25 | -0.08 | -0.17 | -0.05 |
| Weighted Avg Shares Out | 867.89M | 768.10M | 674.21M | 531.45M | 393.29M | 129.65M | 129.65M | 129.43M | 106.95M | 94.30M | 92.08M | 92.03M | 87.06M | 57.65M | 27.05M | 27.05M | 27.05M | 24.70M | 16.81M | 5.95M |
| Weighted Avg Shares Out (Dil) | 867.89M | 768.10M | 674.21M | 531.45M | 393.29M | 129.65M | 129.65M | 129.43M | 106.95M | 94.30M | 92.08M | 92.03M | 87.06M | 57.65M | 27.05M | 27.05M | 27.05M | 25.73M | 16.81M | 5.95M |

Talon Metals Drilling Intersects Entirely New Area of Nickel Mineralization
Talon Metals: A U.S. Nickel Mining Industry
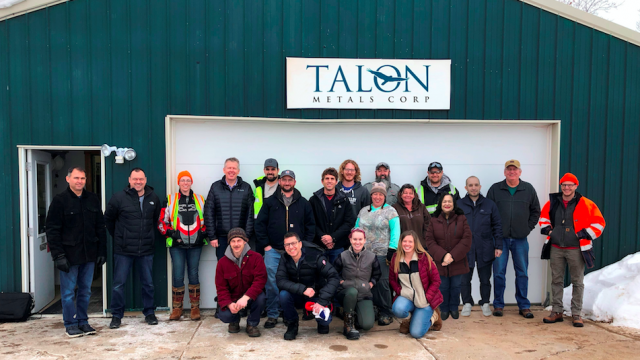
Talon Metals submits environmental assessment worksheet for responsible development of Tamarack nickel project
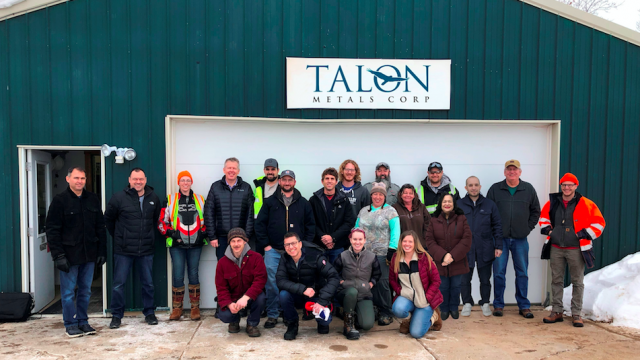
Talon Metals intersects high-grade nickel in newly discovered zone; looks to further drilling

Talon Metals says it spent $52.9M on Tamarack Nickel Project in 2022
Talon Metals hails EV tax credit guidance on battery component and critical mineral sourcing requirements

Talon Metals and EnviCore studying potential of transforming mining waste into usable materials

Talon Metals: Tamarack Nickel Project Is Progressing Well, U.S. Government Support And Tesla Off-Take Are Positives
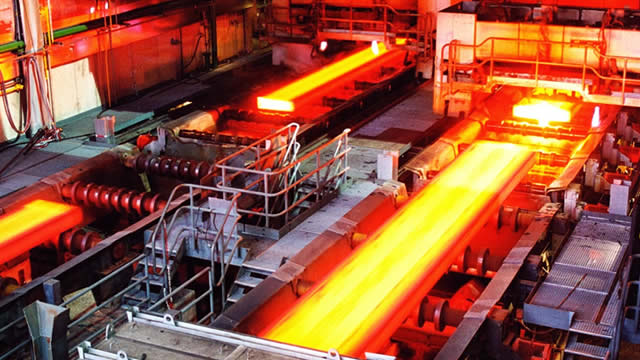
Talon Metals identifies 'high-grade nickel mineralization' system
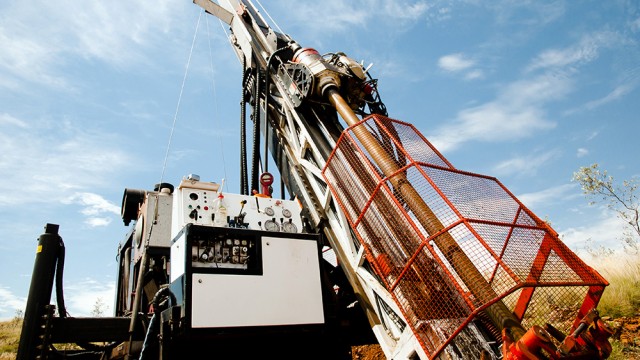
Talon Metals confirms potential new high-grade nickel mineralization system at its Tamarack project in Minnesota
Source: https://incomestatements.info
Category: Stock Reports
