See more : Enthusiast Gaming Holdings Inc. (EGLX) Income Statement Analysis – Financial Results
Complete financial analysis of Talon Metals Corp. (TLOFF) income statement, including revenue, profit margins, EPS and key performance metrics. Get detailed insights into the financial performance of Talon Metals Corp., a leading company in the Industrial Materials industry within the Basic Materials sector.
- Gold Basin Resources Corporation (GXXFF) Income Statement Analysis – Financial Results
- Rana Sugars Limited (RANASUG.NS) Income Statement Analysis – Financial Results
- Impax Environmental Markets plc (IEM.L) Income Statement Analysis – Financial Results
- Euro Sun Mining Inc. (ESM.TO) Income Statement Analysis – Financial Results
- InterRent Real Estate Investment Trust (IIP-UN.TO) Income Statement Analysis – Financial Results
Talon Metals Corp. (TLOFF)
About Talon Metals Corp.
Talon Metals Corp., a mineral exploration company, explores for and develops mineral properties. The company owns a 17.56% interest is the Tamarack nickel-copper-cobalt project located in Minnesota, the United States. It has an option to acquire 80% interest in the mineral rights over a land package covering an area of approximately 4,00,000 acres located in the Upper Peninsula of the State of Michigan. The company is headquartered in Road Town, the British Virgin Islands.
| Metric | 2023 | 2022 | 2021 | 2020 | 2019 | 2018 | 2017 | 2016 | 2015 | 2014 | 2013 | 2012 | 2011 | 2010 | 2009 | 2008 | 2007 | 2006 | 2005 | 2004 |
|---|---|---|---|---|---|---|---|---|---|---|---|---|---|---|---|---|---|---|---|---|
| Revenue | 0.00 | 0.00 | 0.00 | 0.00 | 0.00 | 0.00 | 0.00 | 0.00 | 0.00 | 0.00 | 0.00 | 0.00 | 1.29M | 4.23M | 0.00 | 124.65K | 415.31K | 427.93K | 52.07K | 0.00 |
| Cost of Revenue | 50.52K | 36.11K | 13.90K | 8.96K | 10.30K | 5.97K | 9.90K | 20.35K | 57.42K | 39.38K | 21.99K | 35.55K | 34.87K | 0.00 | 0.00 | 0.00 | 0.00 | 0.00 | 392.52K | 223.83K |
| Gross Profit | -50.52K | -36.11K | -13.90K | -8.96K | -10.30K | -5.97K | -9.90K | -20.35K | -57.42K | -39.38K | -21.99K | -35.55K | 1.25M | 4.23M | 0.00 | 124.65K | 415.31K | 427.93K | -340.44K | -223.83K |
| Gross Profit Ratio | 0.00% | 0.00% | 0.00% | 0.00% | 0.00% | 0.00% | 0.00% | 0.00% | 0.00% | 0.00% | 0.00% | 0.00% | 97.29% | 100.00% | 0.00% | 100.00% | 100.00% | 100.00% | -653.78% | 0.00% |
| Research & Development | 0.00 | 0.00 | 0.00 | 0.00 | 0.00 | 0.00 | 0.00 | 0.00 | 0.00 | 0.00 | 0.00 | 0.00 | 0.00 | 0.00 | 0.00 | 0.00 | 0.00 | 0.00 | 0.00 | 0.00 |
| General & Administrative | 533.38K | 3.49M | 6.02M | 2.11M | 3.33M | 817.02K | 668.08K | 923.95K | 2.41M | 2.02M | 2.06M | 5.67M | 11.50M | 6.86M | 3.12M | 2.05M | 1.77M | 0.00 | 0.00 | 0.00 |
| Selling & Marketing | 355.09K | 441.81K | 234.84K | 264.95K | 86.08K | 0.00 | 0.00 | 0.00 | 0.00 | 0.00 | 0.00 | 0.00 | 0.00 | 0.00 | 0.00 | 0.00 | 100.78K | 0.00 | 0.00 | 0.00 |
| SG&A | 2.41M | 3.94M | 6.25M | 2.38M | 3.42M | 817.02K | 668.08K | 923.95K | 2.41M | 2.02M | 2.06M | 5.67M | 11.50M | 6.86M | 3.12M | 2.05M | 1.87M | 2.21M | 2.43M | 70.78K |
| Other Expenses | 0.00 | 0.00 | 0.00 | 0.00 | 54.73K | -8.42M | 7.91K | 0.00 | 2.44M | -40.64K | 0.00 | 0.00 | 196.28K | 0.00 | 0.00 | 0.00 | 0.00 | 0.00 | 0.00 | 0.00 |
| Operating Expenses | 2.41M | 3.97M | 6.26M | 2.38M | 3.43M | 817.02K | 668.08K | 923.95K | 2.11M | 2.93M | 4.73M | 5.70M | 11.53M | 6.88M | 3.14M | 2.17M | 1.99M | 2.21M | 2.43M | 71.73K |
| Cost & Expenses | 2.41M | 3.97M | 6.26M | 2.38M | 3.44M | 822.99K | 677.98K | 944.30K | 2.17M | 2.97M | 4.75M | 5.73M | 11.53M | 6.88M | 3.14M | 2.17M | 1.99M | 2.21M | 2.83M | 295.56K |
| Interest Income | 968.52K | 266.28K | 15.34K | 14.59K | 17.98K | 3.00K | 4.24K | 3.16K | 6.31K | 46.96K | 75.54K | 200.34K | 810.40K | 73.51K | 12.66K | 270.64K | 415.31K | 427.93K | 0.00 | 0.00 |
| Interest Expense | 0.00 | 0.00 | 0.00 | 0.00 | 31.40K | 149.04K | 0.00 | 0.00 | 0.00 | 0.00 | 0.00 | 0.00 | 168.41K | 28.46K | 53.71K | 103.68K | 99.44K | 55.68K | 20.83K | 1.98K |
| Depreciation & Amortization | 50.52K | 36.11K | 13.90K | 8.96K | 22.63K | 5.97K | 9.90K | 20.35K | 57.42K | 39.38K | 21.99K | 35.55K | 34.87K | 23.12K | 20.00K | 20.00K | 17.94K | 6.00K | 3.28K | 948.00 |
| EBITDA | -2.36M | -3.51M | -6.04M | -2.37M | -3.33M | -761.55K | -655.94K | -862.22K | 3.86M | 11.36M | -4.77M | 5.07M | -6.92M | -2.55M | -3.11M | -6.71M | -1.56M | -1.78M | -2.77M | -294.61K |
| EBITDA Ratio | 0.00% | 0.00% | 0.00% | 0.00% | 0.00% | 0.00% | 0.00% | 0.00% | 0.00% | 0.00% | 0.00% | 0.00% | -538.49% | -62.75% | 0.00% | -1,404.18% | -374.66% | -415.37% | -5,321.01% | 0.00% |
| Operating Income | -2.41M | -6.18M | -6.97M | -2.37M | -3.50M | -820.00K | 1.81M | 941.15K | 2.46M | 3.02M | 2.01M | 5.58M | -6.96M | 2.57M | 3.21M | 1.77M | 1.57M | 1.78M | 2.77M | 295.56K |
| Operating Income Ratio | 0.00% | 0.00% | 0.00% | 0.00% | 0.00% | 0.00% | 0.00% | 0.00% | 0.00% | 0.00% | 0.00% | 0.00% | -541.21% | 60.79% | 0.00% | 1,420.22% | 378.98% | 416.77% | 5,327.30% | 0.00% |
| Total Other Income/Expenses | 65.15K | 2.04M | 504.01K | -448.73K | -647.69K | -8.68M | -2.51M | -503.25K | -4.00M | -14.34M | -1.14M | -23.98M | 34.87K | -6.92M | -5.05M | -8.60M | 8.32M | -1.78M | -2.77M | 0.00 |
| Income Before Tax | -2.35M | -1.50M | -5.55M | -2.73M | -3.98M | -9.44M | -3.15M | -1.37M | -6.30M | -17.25M | -7.17M | -18.40M | -10.25M | -4.35M | -1.84M | -6.83M | 9.90M | 1.65M | 2.76M | 0.00 |
| Income Before Tax Ratio | 0.00% | 0.00% | 0.00% | 0.00% | 0.00% | 0.00% | 0.00% | 0.00% | 0.00% | 0.00% | 0.00% | 0.00% | -797.07% | -102.63% | 0.00% | -5,481.88% | 2,383.23% | 384.75% | 5,305.86% | 0.00% |
| Income Tax Expense | 0.00 | -2.51M | -732.29K | -8.96K | 86.13K | 149.04K | 2.48M | 421.18K | 6.57M | 14.24M | 2.20M | 10.56M | 2.84M | -100.49K | 53.71K | 103.68K | -3.66K | 55.68K | 72.90K | 1.98K |
| Net Income | -2.35M | -1.50M | -5.55M | -2.73M | -3.98M | -9.44M | -3.15M | -1.37M | -6.30M | -17.25M | -7.17M | -18.40M | -13.08M | -4.32M | -1.84M | -6.83M | 6.75M | -1.98M | -2.86M | -297.54K |
| Net Income Ratio | 0.00% | 0.00% | 0.00% | 0.00% | 0.00% | 0.00% | 0.00% | 0.00% | 0.00% | 0.00% | 0.00% | 0.00% | -1,017.76% | -102.09% | 0.00% | -5,481.88% | 1,626.16% | -461.81% | -5,488.73% | 0.00% |
| EPS | 0.00 | 0.00 | -0.01 | -0.01 | -0.01 | -0.07 | -0.02 | -0.01 | -0.06 | -0.18 | -0.08 | -0.20 | -0.15 | -0.08 | -0.07 | -0.25 | 0.25 | -0.08 | -0.17 | -0.05 |
| EPS Diluted | 0.00 | 0.00 | -0.01 | -0.01 | -0.01 | -0.07 | -0.02 | -0.01 | -0.06 | -0.18 | -0.08 | -0.20 | -0.15 | -0.08 | -0.07 | -0.25 | 0.25 | -0.08 | -0.17 | -0.05 |
| Weighted Avg Shares Out | 867.89M | 768.10M | 674.21M | 531.45M | 393.29M | 129.65M | 129.65M | 129.43M | 106.95M | 94.30M | 92.08M | 92.03M | 87.06M | 57.65M | 27.05M | 27.05M | 27.05M | 24.70M | 16.81M | 5.95M |
| Weighted Avg Shares Out (Dil) | 867.89M | 768.10M | 674.21M | 531.45M | 393.29M | 129.65M | 129.65M | 129.43M | 106.95M | 94.30M | 92.08M | 92.03M | 87.06M | 57.65M | 27.05M | 27.05M | 27.05M | 25.73M | 16.81M | 5.95M |

Talon Metals releases record-length nickel-copper intercept from Tamarack resource area
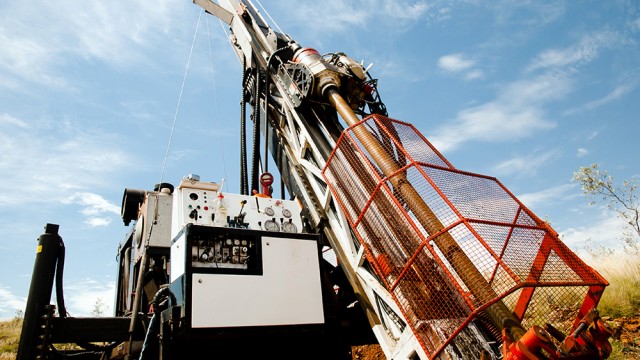
Talon Metals buys three more drill rigs to expand exploration of its Tamarack project in Minnesota

Talon Metals And The Defense Production Act
Talon Metals says it spent $38 million on the Tamarack nickel project in 2021

Talon Metals reveals more high-grade nickel and copper intercepts from outside Tamarack resource area in Minnesota

Metals Stocks News: What's Going on with HYMC, TMC, PLM, NAK, AQMS Stocks Today?

Electra Battery Materials partners with Ontario government, Glencore, and Talon Metals on battery materials park study
Talon Metals reduces existing net smelter royalty on world-class Tamarack asset to 1.85% for US$4.5M in cash

Talon Metals hits nickel-copper mineralization outside Tamarack resource area once again, new drill results reveal
Talon Metals closes previously announced bought-deal public offering for aggregate gross proceeds of $27,504,000
Source: https://incomestatements.info
Category: Stock Reports
