See more : Vichitbhan Palmoil Public Company Limited (VPO.BK) Income Statement Analysis – Financial Results
Complete financial analysis of Talon Metals Corp. (TLOFF) income statement, including revenue, profit margins, EPS and key performance metrics. Get detailed insights into the financial performance of Talon Metals Corp., a leading company in the Industrial Materials industry within the Basic Materials sector.
- TWFG, Inc. Common Stock (TWFG) Income Statement Analysis – Financial Results
- PDS Limited (PDSL.BO) Income Statement Analysis – Financial Results
- PT Austindo Nusantara Jaya Tbk (ANJT.JK) Income Statement Analysis – Financial Results
- FAST Acquisition Corp. (FST) Income Statement Analysis – Financial Results
- African Agriculture Holdings Inc. (AAGR) Income Statement Analysis – Financial Results
Talon Metals Corp. (TLOFF)
About Talon Metals Corp.
Talon Metals Corp., a mineral exploration company, explores for and develops mineral properties. The company owns a 17.56% interest is the Tamarack nickel-copper-cobalt project located in Minnesota, the United States. It has an option to acquire 80% interest in the mineral rights over a land package covering an area of approximately 4,00,000 acres located in the Upper Peninsula of the State of Michigan. The company is headquartered in Road Town, the British Virgin Islands.
| Metric | 2023 | 2022 | 2021 | 2020 | 2019 | 2018 | 2017 | 2016 | 2015 | 2014 | 2013 | 2012 | 2011 | 2010 | 2009 | 2008 | 2007 | 2006 | 2005 | 2004 |
|---|---|---|---|---|---|---|---|---|---|---|---|---|---|---|---|---|---|---|---|---|
| Revenue | 0.00 | 0.00 | 0.00 | 0.00 | 0.00 | 0.00 | 0.00 | 0.00 | 0.00 | 0.00 | 0.00 | 0.00 | 1.29M | 4.23M | 0.00 | 124.65K | 415.31K | 427.93K | 52.07K | 0.00 |
| Cost of Revenue | 50.52K | 36.11K | 13.90K | 8.96K | 10.30K | 5.97K | 9.90K | 20.35K | 57.42K | 39.38K | 21.99K | 35.55K | 34.87K | 0.00 | 0.00 | 0.00 | 0.00 | 0.00 | 392.52K | 223.83K |
| Gross Profit | -50.52K | -36.11K | -13.90K | -8.96K | -10.30K | -5.97K | -9.90K | -20.35K | -57.42K | -39.38K | -21.99K | -35.55K | 1.25M | 4.23M | 0.00 | 124.65K | 415.31K | 427.93K | -340.44K | -223.83K |
| Gross Profit Ratio | 0.00% | 0.00% | 0.00% | 0.00% | 0.00% | 0.00% | 0.00% | 0.00% | 0.00% | 0.00% | 0.00% | 0.00% | 97.29% | 100.00% | 0.00% | 100.00% | 100.00% | 100.00% | -653.78% | 0.00% |
| Research & Development | 0.00 | 0.00 | 0.00 | 0.00 | 0.00 | 0.00 | 0.00 | 0.00 | 0.00 | 0.00 | 0.00 | 0.00 | 0.00 | 0.00 | 0.00 | 0.00 | 0.00 | 0.00 | 0.00 | 0.00 |
| General & Administrative | 533.38K | 3.49M | 6.02M | 2.11M | 3.33M | 817.02K | 668.08K | 923.95K | 2.41M | 2.02M | 2.06M | 5.67M | 11.50M | 6.86M | 3.12M | 2.05M | 1.77M | 0.00 | 0.00 | 0.00 |
| Selling & Marketing | 355.09K | 441.81K | 234.84K | 264.95K | 86.08K | 0.00 | 0.00 | 0.00 | 0.00 | 0.00 | 0.00 | 0.00 | 0.00 | 0.00 | 0.00 | 0.00 | 100.78K | 0.00 | 0.00 | 0.00 |
| SG&A | 2.41M | 3.94M | 6.25M | 2.38M | 3.42M | 817.02K | 668.08K | 923.95K | 2.41M | 2.02M | 2.06M | 5.67M | 11.50M | 6.86M | 3.12M | 2.05M | 1.87M | 2.21M | 2.43M | 70.78K |
| Other Expenses | 0.00 | 0.00 | 0.00 | 0.00 | 54.73K | -8.42M | 7.91K | 0.00 | 2.44M | -40.64K | 0.00 | 0.00 | 196.28K | 0.00 | 0.00 | 0.00 | 0.00 | 0.00 | 0.00 | 0.00 |
| Operating Expenses | 2.41M | 3.97M | 6.26M | 2.38M | 3.43M | 817.02K | 668.08K | 923.95K | 2.11M | 2.93M | 4.73M | 5.70M | 11.53M | 6.88M | 3.14M | 2.17M | 1.99M | 2.21M | 2.43M | 71.73K |
| Cost & Expenses | 2.41M | 3.97M | 6.26M | 2.38M | 3.44M | 822.99K | 677.98K | 944.30K | 2.17M | 2.97M | 4.75M | 5.73M | 11.53M | 6.88M | 3.14M | 2.17M | 1.99M | 2.21M | 2.83M | 295.56K |
| Interest Income | 968.52K | 266.28K | 15.34K | 14.59K | 17.98K | 3.00K | 4.24K | 3.16K | 6.31K | 46.96K | 75.54K | 200.34K | 810.40K | 73.51K | 12.66K | 270.64K | 415.31K | 427.93K | 0.00 | 0.00 |
| Interest Expense | 0.00 | 0.00 | 0.00 | 0.00 | 31.40K | 149.04K | 0.00 | 0.00 | 0.00 | 0.00 | 0.00 | 0.00 | 168.41K | 28.46K | 53.71K | 103.68K | 99.44K | 55.68K | 20.83K | 1.98K |
| Depreciation & Amortization | 50.52K | 36.11K | 13.90K | 8.96K | 22.63K | 5.97K | 9.90K | 20.35K | 57.42K | 39.38K | 21.99K | 35.55K | 34.87K | 23.12K | 20.00K | 20.00K | 17.94K | 6.00K | 3.28K | 948.00 |
| EBITDA | -2.36M | -3.51M | -6.04M | -2.37M | -3.33M | -761.55K | -655.94K | -862.22K | 3.86M | 11.36M | -4.77M | 5.07M | -6.92M | -2.55M | -3.11M | -6.71M | -1.56M | -1.78M | -2.77M | -294.61K |
| EBITDA Ratio | 0.00% | 0.00% | 0.00% | 0.00% | 0.00% | 0.00% | 0.00% | 0.00% | 0.00% | 0.00% | 0.00% | 0.00% | -538.49% | -62.75% | 0.00% | -1,404.18% | -374.66% | -415.37% | -5,321.01% | 0.00% |
| Operating Income | -2.41M | -6.18M | -6.97M | -2.37M | -3.50M | -820.00K | 1.81M | 941.15K | 2.46M | 3.02M | 2.01M | 5.58M | -6.96M | 2.57M | 3.21M | 1.77M | 1.57M | 1.78M | 2.77M | 295.56K |
| Operating Income Ratio | 0.00% | 0.00% | 0.00% | 0.00% | 0.00% | 0.00% | 0.00% | 0.00% | 0.00% | 0.00% | 0.00% | 0.00% | -541.21% | 60.79% | 0.00% | 1,420.22% | 378.98% | 416.77% | 5,327.30% | 0.00% |
| Total Other Income/Expenses | 65.15K | 2.04M | 504.01K | -448.73K | -647.69K | -8.68M | -2.51M | -503.25K | -4.00M | -14.34M | -1.14M | -23.98M | 34.87K | -6.92M | -5.05M | -8.60M | 8.32M | -1.78M | -2.77M | 0.00 |
| Income Before Tax | -2.35M | -1.50M | -5.55M | -2.73M | -3.98M | -9.44M | -3.15M | -1.37M | -6.30M | -17.25M | -7.17M | -18.40M | -10.25M | -4.35M | -1.84M | -6.83M | 9.90M | 1.65M | 2.76M | 0.00 |
| Income Before Tax Ratio | 0.00% | 0.00% | 0.00% | 0.00% | 0.00% | 0.00% | 0.00% | 0.00% | 0.00% | 0.00% | 0.00% | 0.00% | -797.07% | -102.63% | 0.00% | -5,481.88% | 2,383.23% | 384.75% | 5,305.86% | 0.00% |
| Income Tax Expense | 0.00 | -2.51M | -732.29K | -8.96K | 86.13K | 149.04K | 2.48M | 421.18K | 6.57M | 14.24M | 2.20M | 10.56M | 2.84M | -100.49K | 53.71K | 103.68K | -3.66K | 55.68K | 72.90K | 1.98K |
| Net Income | -2.35M | -1.50M | -5.55M | -2.73M | -3.98M | -9.44M | -3.15M | -1.37M | -6.30M | -17.25M | -7.17M | -18.40M | -13.08M | -4.32M | -1.84M | -6.83M | 6.75M | -1.98M | -2.86M | -297.54K |
| Net Income Ratio | 0.00% | 0.00% | 0.00% | 0.00% | 0.00% | 0.00% | 0.00% | 0.00% | 0.00% | 0.00% | 0.00% | 0.00% | -1,017.76% | -102.09% | 0.00% | -5,481.88% | 1,626.16% | -461.81% | -5,488.73% | 0.00% |
| EPS | 0.00 | 0.00 | -0.01 | -0.01 | -0.01 | -0.07 | -0.02 | -0.01 | -0.06 | -0.18 | -0.08 | -0.20 | -0.15 | -0.08 | -0.07 | -0.25 | 0.25 | -0.08 | -0.17 | -0.05 |
| EPS Diluted | 0.00 | 0.00 | -0.01 | -0.01 | -0.01 | -0.07 | -0.02 | -0.01 | -0.06 | -0.18 | -0.08 | -0.20 | -0.15 | -0.08 | -0.07 | -0.25 | 0.25 | -0.08 | -0.17 | -0.05 |
| Weighted Avg Shares Out | 867.89M | 768.10M | 674.21M | 531.45M | 393.29M | 129.65M | 129.65M | 129.43M | 106.95M | 94.30M | 92.08M | 92.03M | 87.06M | 57.65M | 27.05M | 27.05M | 27.05M | 24.70M | 16.81M | 5.95M |
| Weighted Avg Shares Out (Dil) | 867.89M | 768.10M | 674.21M | 531.45M | 393.29M | 129.65M | 129.65M | 129.43M | 106.95M | 94.30M | 92.08M | 92.03M | 87.06M | 57.65M | 27.05M | 27.05M | 27.05M | 25.73M | 16.81M | 5.95M |
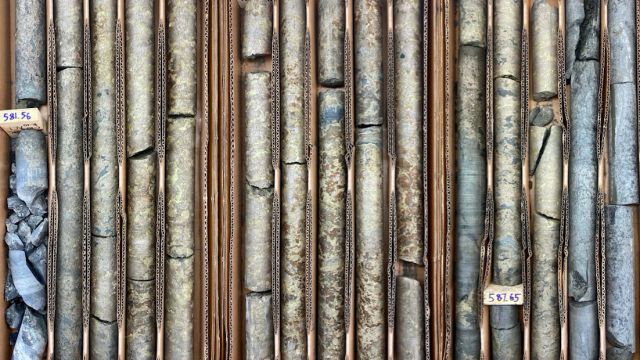
Talon Metals' record drill result from Tamarack project in Minnesota draws analyst attention

Talon Metals Corp joins DPI Mining's Responsible Sourcing Coalition as a supporter
Talon Metals unveils new record drill result at Tamarack project in Minnesota
Stifel says Tamarack assay results support strong resource growth expectations at Talon Metals
Stifel hails Talon Metals latest Tamarack assay results and says it has high confidence it will expand resources
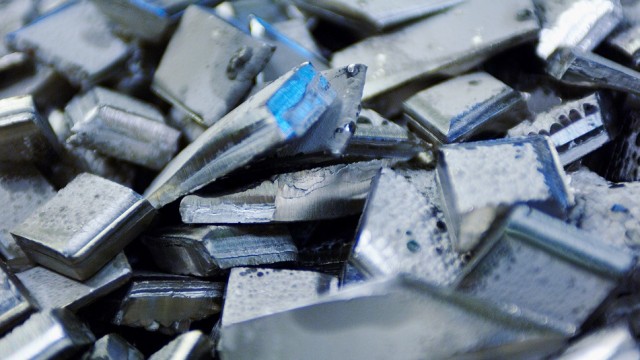
Talon Metals uncovers 'more thick, high-grade' nickel-copper mineralization outside main resource area at Minnesota project
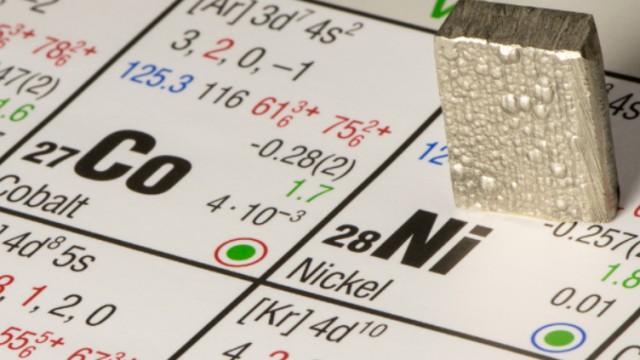
Talon Metals acquires exploration rights from Sweetwater Royalties for historic Henry Ford land package in Michigan
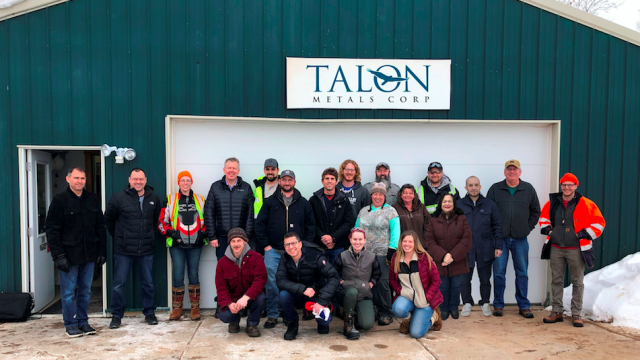
Talon Metals Corp earns 'Buy' rating from Stifel in coverage initiation note
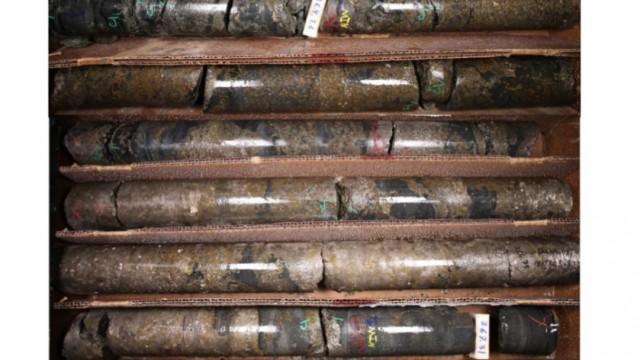
Talon Metals reports promising assay results from Tamarack Nickel-Copper-Cobalt Project in Minnesota
Nickel Miners' News For The Month Of May 2022
Source: https://incomestatements.info
Category: Stock Reports
