See more : Wave Entertainment Public Company Limited (WAVE.BK) Income Statement Analysis – Financial Results
Complete financial analysis of Talon Metals Corp. (TLOFF) income statement, including revenue, profit margins, EPS and key performance metrics. Get detailed insights into the financial performance of Talon Metals Corp., a leading company in the Industrial Materials industry within the Basic Materials sector.
- Sichuan Hexie Shuangma Co., Ltd. (000935.SZ) Income Statement Analysis – Financial Results
- ePlay Digital Inc. (EPYFF) Income Statement Analysis – Financial Results
- Bitdeer Technologies Group (BTDR) Income Statement Analysis – Financial Results
- Walvax Biotechnology Co., Ltd. (300142.SZ) Income Statement Analysis – Financial Results
- Koh Young Technology Inc. (098460.KQ) Income Statement Analysis – Financial Results
Talon Metals Corp. (TLOFF)
About Talon Metals Corp.
Talon Metals Corp., a mineral exploration company, explores for and develops mineral properties. The company owns a 17.56% interest is the Tamarack nickel-copper-cobalt project located in Minnesota, the United States. It has an option to acquire 80% interest in the mineral rights over a land package covering an area of approximately 4,00,000 acres located in the Upper Peninsula of the State of Michigan. The company is headquartered in Road Town, the British Virgin Islands.
| Metric | 2023 | 2022 | 2021 | 2020 | 2019 | 2018 | 2017 | 2016 | 2015 | 2014 | 2013 | 2012 | 2011 | 2010 | 2009 | 2008 | 2007 | 2006 | 2005 | 2004 |
|---|---|---|---|---|---|---|---|---|---|---|---|---|---|---|---|---|---|---|---|---|
| Revenue | 0.00 | 0.00 | 0.00 | 0.00 | 0.00 | 0.00 | 0.00 | 0.00 | 0.00 | 0.00 | 0.00 | 0.00 | 1.29M | 4.23M | 0.00 | 124.65K | 415.31K | 427.93K | 52.07K | 0.00 |
| Cost of Revenue | 50.52K | 36.11K | 13.90K | 8.96K | 10.30K | 5.97K | 9.90K | 20.35K | 57.42K | 39.38K | 21.99K | 35.55K | 34.87K | 0.00 | 0.00 | 0.00 | 0.00 | 0.00 | 392.52K | 223.83K |
| Gross Profit | -50.52K | -36.11K | -13.90K | -8.96K | -10.30K | -5.97K | -9.90K | -20.35K | -57.42K | -39.38K | -21.99K | -35.55K | 1.25M | 4.23M | 0.00 | 124.65K | 415.31K | 427.93K | -340.44K | -223.83K |
| Gross Profit Ratio | 0.00% | 0.00% | 0.00% | 0.00% | 0.00% | 0.00% | 0.00% | 0.00% | 0.00% | 0.00% | 0.00% | 0.00% | 97.29% | 100.00% | 0.00% | 100.00% | 100.00% | 100.00% | -653.78% | 0.00% |
| Research & Development | 0.00 | 0.00 | 0.00 | 0.00 | 0.00 | 0.00 | 0.00 | 0.00 | 0.00 | 0.00 | 0.00 | 0.00 | 0.00 | 0.00 | 0.00 | 0.00 | 0.00 | 0.00 | 0.00 | 0.00 |
| General & Administrative | 533.38K | 3.49M | 6.02M | 2.11M | 3.33M | 817.02K | 668.08K | 923.95K | 2.41M | 2.02M | 2.06M | 5.67M | 11.50M | 6.86M | 3.12M | 2.05M | 1.77M | 0.00 | 0.00 | 0.00 |
| Selling & Marketing | 355.09K | 441.81K | 234.84K | 264.95K | 86.08K | 0.00 | 0.00 | 0.00 | 0.00 | 0.00 | 0.00 | 0.00 | 0.00 | 0.00 | 0.00 | 0.00 | 100.78K | 0.00 | 0.00 | 0.00 |
| SG&A | 2.41M | 3.94M | 6.25M | 2.38M | 3.42M | 817.02K | 668.08K | 923.95K | 2.41M | 2.02M | 2.06M | 5.67M | 11.50M | 6.86M | 3.12M | 2.05M | 1.87M | 2.21M | 2.43M | 70.78K |
| Other Expenses | 0.00 | 0.00 | 0.00 | 0.00 | 54.73K | -8.42M | 7.91K | 0.00 | 2.44M | -40.64K | 0.00 | 0.00 | 196.28K | 0.00 | 0.00 | 0.00 | 0.00 | 0.00 | 0.00 | 0.00 |
| Operating Expenses | 2.41M | 3.97M | 6.26M | 2.38M | 3.43M | 817.02K | 668.08K | 923.95K | 2.11M | 2.93M | 4.73M | 5.70M | 11.53M | 6.88M | 3.14M | 2.17M | 1.99M | 2.21M | 2.43M | 71.73K |
| Cost & Expenses | 2.41M | 3.97M | 6.26M | 2.38M | 3.44M | 822.99K | 677.98K | 944.30K | 2.17M | 2.97M | 4.75M | 5.73M | 11.53M | 6.88M | 3.14M | 2.17M | 1.99M | 2.21M | 2.83M | 295.56K |
| Interest Income | 968.52K | 266.28K | 15.34K | 14.59K | 17.98K | 3.00K | 4.24K | 3.16K | 6.31K | 46.96K | 75.54K | 200.34K | 810.40K | 73.51K | 12.66K | 270.64K | 415.31K | 427.93K | 0.00 | 0.00 |
| Interest Expense | 0.00 | 0.00 | 0.00 | 0.00 | 31.40K | 149.04K | 0.00 | 0.00 | 0.00 | 0.00 | 0.00 | 0.00 | 168.41K | 28.46K | 53.71K | 103.68K | 99.44K | 55.68K | 20.83K | 1.98K |
| Depreciation & Amortization | 50.52K | 36.11K | 13.90K | 8.96K | 22.63K | 5.97K | 9.90K | 20.35K | 57.42K | 39.38K | 21.99K | 35.55K | 34.87K | 23.12K | 20.00K | 20.00K | 17.94K | 6.00K | 3.28K | 948.00 |
| EBITDA | -2.36M | -3.51M | -6.04M | -2.37M | -3.33M | -761.55K | -655.94K | -862.22K | 3.86M | 11.36M | -4.77M | 5.07M | -6.92M | -2.55M | -3.11M | -6.71M | -1.56M | -1.78M | -2.77M | -294.61K |
| EBITDA Ratio | 0.00% | 0.00% | 0.00% | 0.00% | 0.00% | 0.00% | 0.00% | 0.00% | 0.00% | 0.00% | 0.00% | 0.00% | -538.49% | -62.75% | 0.00% | -1,404.18% | -374.66% | -415.37% | -5,321.01% | 0.00% |
| Operating Income | -2.41M | -6.18M | -6.97M | -2.37M | -3.50M | -820.00K | 1.81M | 941.15K | 2.46M | 3.02M | 2.01M | 5.58M | -6.96M | 2.57M | 3.21M | 1.77M | 1.57M | 1.78M | 2.77M | 295.56K |
| Operating Income Ratio | 0.00% | 0.00% | 0.00% | 0.00% | 0.00% | 0.00% | 0.00% | 0.00% | 0.00% | 0.00% | 0.00% | 0.00% | -541.21% | 60.79% | 0.00% | 1,420.22% | 378.98% | 416.77% | 5,327.30% | 0.00% |
| Total Other Income/Expenses | 65.15K | 2.04M | 504.01K | -448.73K | -647.69K | -8.68M | -2.51M | -503.25K | -4.00M | -14.34M | -1.14M | -23.98M | 34.87K | -6.92M | -5.05M | -8.60M | 8.32M | -1.78M | -2.77M | 0.00 |
| Income Before Tax | -2.35M | -1.50M | -5.55M | -2.73M | -3.98M | -9.44M | -3.15M | -1.37M | -6.30M | -17.25M | -7.17M | -18.40M | -10.25M | -4.35M | -1.84M | -6.83M | 9.90M | 1.65M | 2.76M | 0.00 |
| Income Before Tax Ratio | 0.00% | 0.00% | 0.00% | 0.00% | 0.00% | 0.00% | 0.00% | 0.00% | 0.00% | 0.00% | 0.00% | 0.00% | -797.07% | -102.63% | 0.00% | -5,481.88% | 2,383.23% | 384.75% | 5,305.86% | 0.00% |
| Income Tax Expense | 0.00 | -2.51M | -732.29K | -8.96K | 86.13K | 149.04K | 2.48M | 421.18K | 6.57M | 14.24M | 2.20M | 10.56M | 2.84M | -100.49K | 53.71K | 103.68K | -3.66K | 55.68K | 72.90K | 1.98K |
| Net Income | -2.35M | -1.50M | -5.55M | -2.73M | -3.98M | -9.44M | -3.15M | -1.37M | -6.30M | -17.25M | -7.17M | -18.40M | -13.08M | -4.32M | -1.84M | -6.83M | 6.75M | -1.98M | -2.86M | -297.54K |
| Net Income Ratio | 0.00% | 0.00% | 0.00% | 0.00% | 0.00% | 0.00% | 0.00% | 0.00% | 0.00% | 0.00% | 0.00% | 0.00% | -1,017.76% | -102.09% | 0.00% | -5,481.88% | 1,626.16% | -461.81% | -5,488.73% | 0.00% |
| EPS | 0.00 | 0.00 | -0.01 | -0.01 | -0.01 | -0.07 | -0.02 | -0.01 | -0.06 | -0.18 | -0.08 | -0.20 | -0.15 | -0.08 | -0.07 | -0.25 | 0.25 | -0.08 | -0.17 | -0.05 |
| EPS Diluted | 0.00 | 0.00 | -0.01 | -0.01 | -0.01 | -0.07 | -0.02 | -0.01 | -0.06 | -0.18 | -0.08 | -0.20 | -0.15 | -0.08 | -0.07 | -0.25 | 0.25 | -0.08 | -0.17 | -0.05 |
| Weighted Avg Shares Out | 867.89M | 768.10M | 674.21M | 531.45M | 393.29M | 129.65M | 129.65M | 129.43M | 106.95M | 94.30M | 92.08M | 92.03M | 87.06M | 57.65M | 27.05M | 27.05M | 27.05M | 24.70M | 16.81M | 5.95M |
| Weighted Avg Shares Out (Dil) | 867.89M | 768.10M | 674.21M | 531.45M | 393.29M | 129.65M | 129.65M | 129.43M | 106.95M | 94.30M | 92.08M | 92.03M | 87.06M | 57.65M | 27.05M | 27.05M | 27.05M | 25.73M | 16.81M | 5.95M |
Talon Metals: The Path Towards Made-In-America Nickel
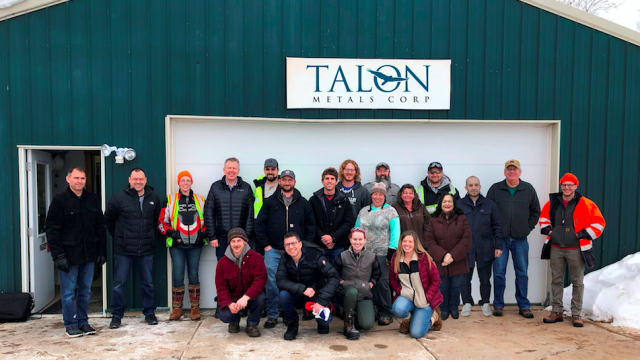
Talon Metals' Tamarack asset continues to be strategic, undervalued nickel project in the US, says Stifel GMP
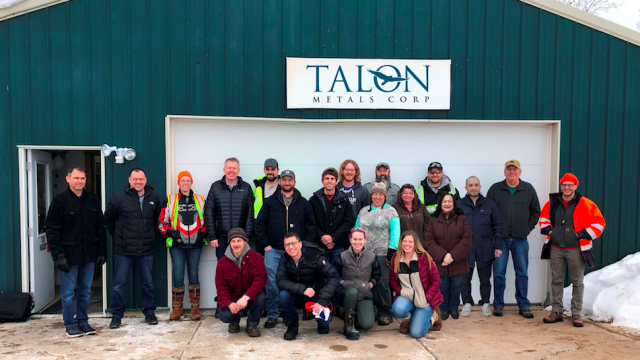
Talon Metals' Tamarack project continues to be strategic, undervalued nickel project in the US, says Stifel GMP

Talon Metals closes $37M bought deal offering to advance work on Tamarack nickel project
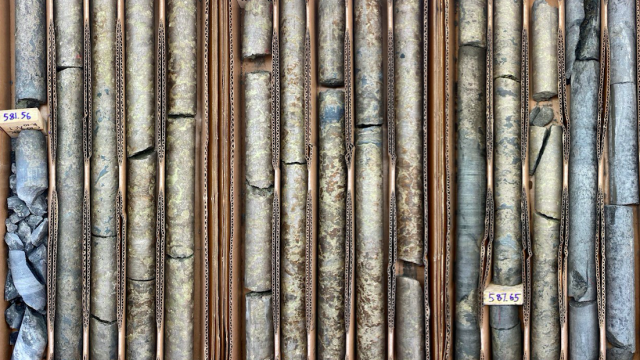
Talon Metals announces $32.5M bought deal public offering
Talon Metals has a lot of room to grow after Tamarack resource upgrade and US government endorsement, Stifel says

Electric vehicle stocks in the spotlight thanks to big week of earnings and acquisitions: Tesla, Mullen, Vicinity Motors, Talon Metals and more
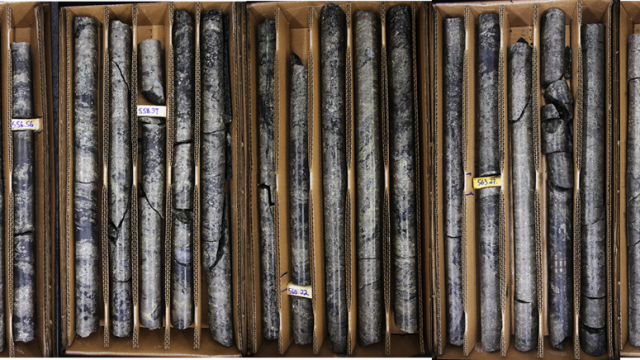
Talon Metals announces surge in mineral resource estimate for Tamarack Nickel Project
Talon Metals soars on $114M US Department of Energy grant to build battery minerals processing facility

Talon Metals to pilot Fleet Space Technologies' satellite-enabled mineral exploration technology ExoSphere at US projects
Source: https://incomestatements.info
Category: Stock Reports
